

What, why and where?
This section covers the movement of freight through ports, shipping and its associated infrastructure.
The Scottish economy is increasingly dependent on the efficient and cost effective movement of freight, by water, air, road and rail, connecting products to markets nationally and internationally. The mode of freight transport used depends on the nature and destination of the freight, with water generally used for non-time sensitive, bulky and heavy international freight. In 2018, one third of Scotland’s total freight tonnage, including exports, was carried by water: 65 million tonnes (Transport Scotland, 2020). In 2018, the eleven major ports accounted for 95% of the total traffic through Scottish ports. There has been a steady decline in freight through Scotland’s eleven major ports: 8% down overall from 2014 to 62 million tonnes in 2018 (Figure 1), driven by a 45% reduction in dry bulk over the same period.
Scotland benefits from a diverse and successful ports sector that contributes significantly to the national, regional and local economies in which they operate. There are over 200 ports, comprising privately owned, local authority and trust ports, plus ports run by Ministry of Defence and Caledonian Maritime Assets Ltd (CMAL) (Table 1). They vary in size from major commercial operations for international exports, ferry ports, ports serving the oil and gas industry in the North Sea and west of Shetland, a new maintenance hub at Wick for offshore renewables, to small leisure and fishing harbours.
Ports develop to cater for changes in demand. For example, a new port area at Aberdeen south is expected to be completed in 2021 (Figure 3) to improve the infrastructure.
|
Port type
|
Number
|
Examples of ports (MAJOR 11, additional 5)(*)
|
|
Private or commercial company
|
63
|
CAIRNRYAN, LOCH RYAN, Ayr, CLYDE (Ardrossan, Glasgow, Greenock, Hunterston), GLENSANDA, DUNDEE, FORTH (Burntisland, Grangemouth, Granton, Inverkeithing, Leith, Methil, Rosyth)
|
|
Local authority owned
|
122
|
ORKNEY (Scapa Flow, Kirkwall, Stromness), SULLOM VOE, Perth
|
|
Trust port
|
32
|
Lerwick, CROMARTY FIRTH (Invergordon), Inverness, PETERHEAD, ABERDEEN, Montrose
|
|
Ministry of Defence
|
2
|
HMNB Clyde, Coulport
|
|
Caledonian Maritime Assets Ltd and British Waterways
|
25
|
Terminals such as Oban, Brodick, Port Ellen, Kennacraig, Ardrishaig.
|

Dry bulk: dry, unpacked produce and raw materials, like grains, coal and sugar that are dropped or poured into the hold of a bulk carrier. Liquid bulk: free-flowing liquid cargoes, like fruit juice, crude oil, liquefied natural gas and chemicals that are poured into the hold of a tanker.


Ports
Ports continue to adapt and develop to support trade, the oil and gas sector, fishing and cruise tourism, as well as developing support for the expanding renewable energy sector. Table a lists some examples of the last few years.
In addition, other types of development include innovations such as the provision of shore-side power facilities. This allows vessels to switch off their diesel engines and use electricity while in port, with environmental and fuel cost benefits. Fraserburgh and Brodick Harbours have both installed shore power connections, with financial assistance from Scottish Government agencies.
Port development to meet new market needs continues. A new fish market opened in Peterhead in 2018 with another two in Shetland (Scalloway and Lerwick) due for completion in 2020. Port infrastructure improvements to support lifeline ferries are being undertaken at Ardrossan, Brodick, Uig, Tarbert and Lochmaddy. A major development at Aberdeen south harbour is due for completion in 2021.
|
Scottish Marine Region (SMR)
|
Port and changes
|
|
North East
|
Aberdeen - south harbour (Nigg Bay) expansion (ongoing, completion due 2021) will include cruise facilities.
Peterhead - new fish market (opened 2018).
|
|
Moray Firth
|
Wick - offshore renewables maintenance hub.
|
|
Orkney Islands
|
Hatston Pier - cruise extension.
|
|
Outer Hebrides
|
Stornoway - new ferry facilities (complete) and cruise quay (early stages).
Lochmaddy - infrastructure improvements to support lifeline ferries.
|
|
West Highland
|
Ullapool - pier and new ferry passenger terminal.
Uig - infrastructure improvements to support lifeline ferries.
|
|
Clyde
|
Greenock Cruise Terminal investment (ongoing).
Ardrossan, Brodick, Tarbert infrastructure improvements to support lifeline ferries.
|
|
Solway
|
Loch Ryan new ferry terminal.
|
Approximately a third of Scotland’s freight (excluding rail and pipeline) was handled by Scotland’s sea ports in 2018, with the vast majority (95%) of this being carried through the 11 major commercial ports (Transport Scotland, 2020).
In 2018, 62 million tonnes of waterborne freight (both incoming and outgoing) passed through the top eleven Scottish ports. This was 16% less than in 2011, continuing a steady fall. In 2018, the eleven major ports accounted for 95% of the total traffic through Scottish ports. Exports accounted for 53.8% of the total freight through the eleven major ports while domestic traffic accounted for 27.7%. Imports were much lower, together accounting for 18.5% of the total freight (Transport Scotland, 2020).
Forth at 26.6 million tonnes was 5% down since 2011; Clyde at 9.1 million tonnes, 32% down; and Glensanda at 5.9 million tonnes about 2% down.
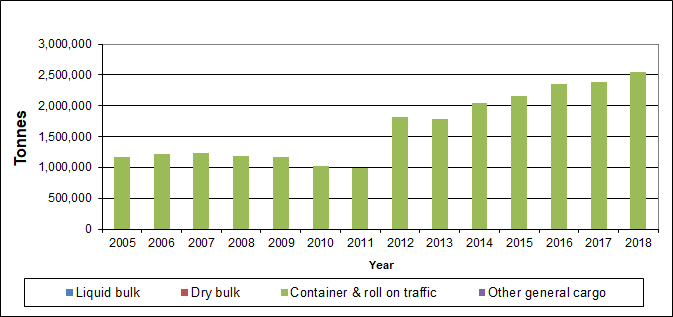
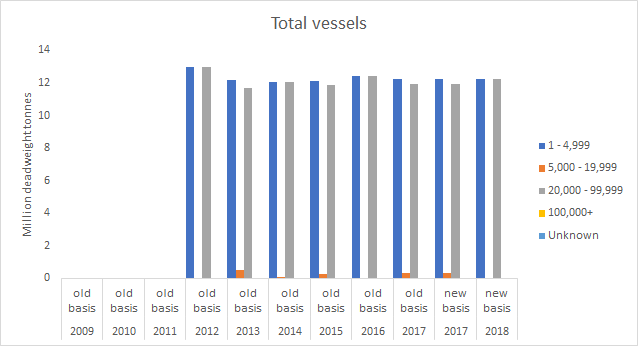
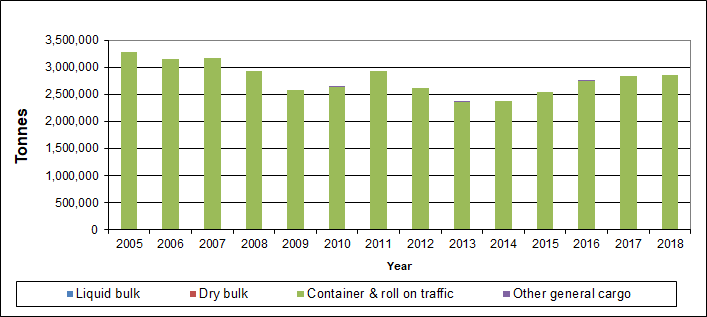
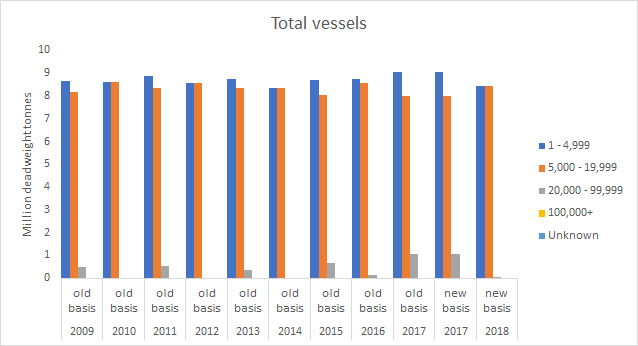
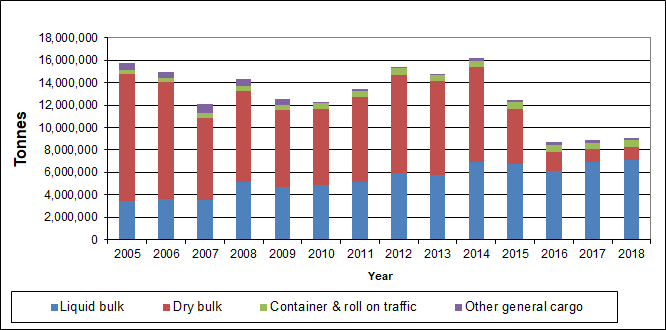
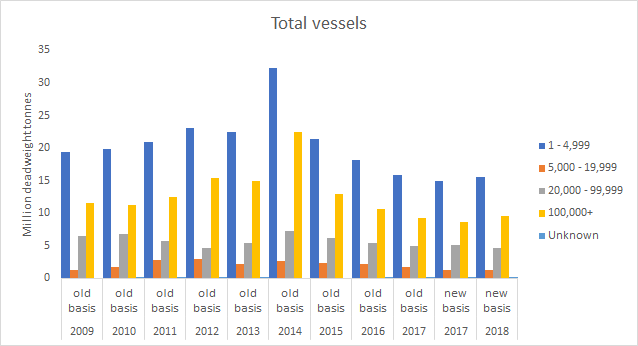
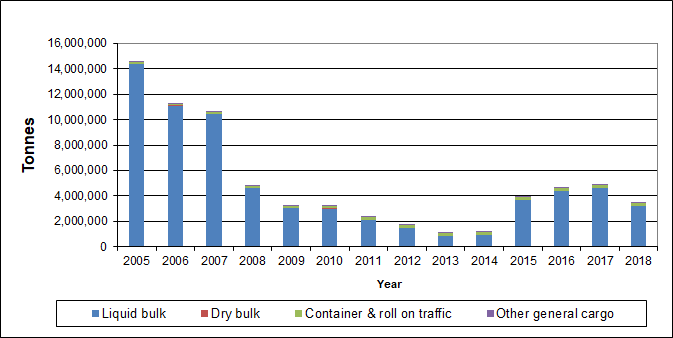
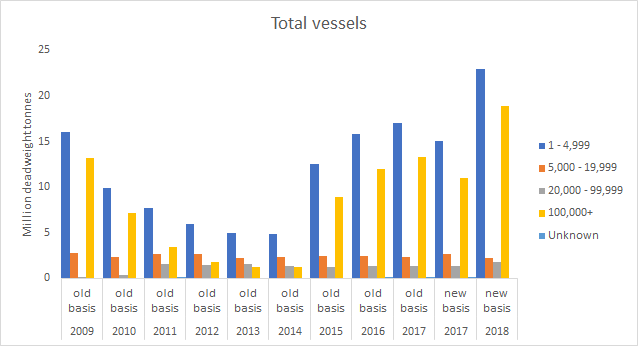
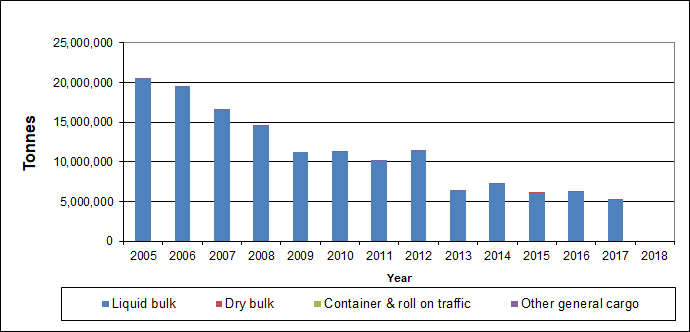
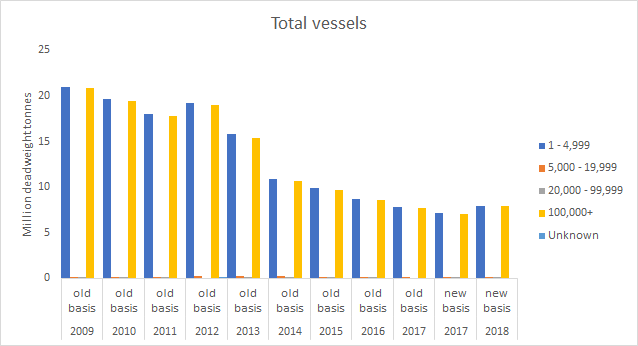
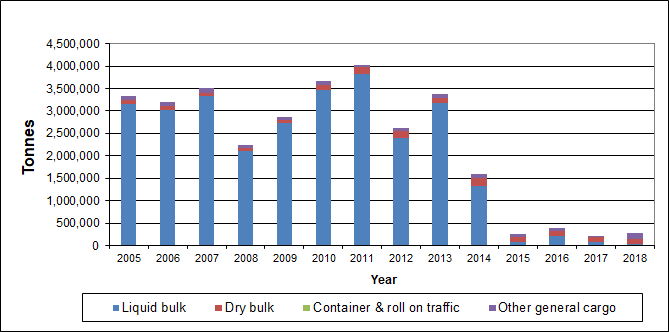
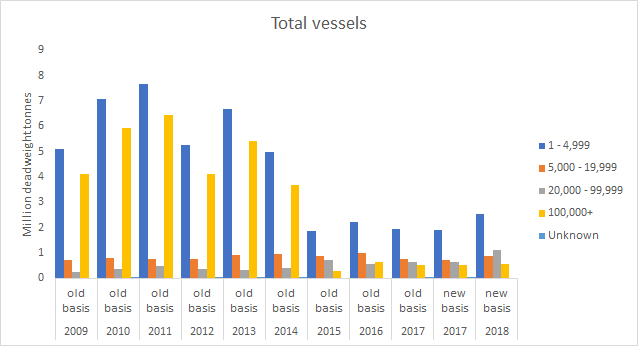
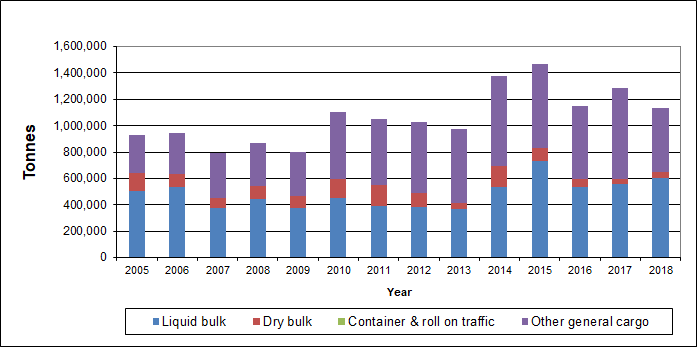
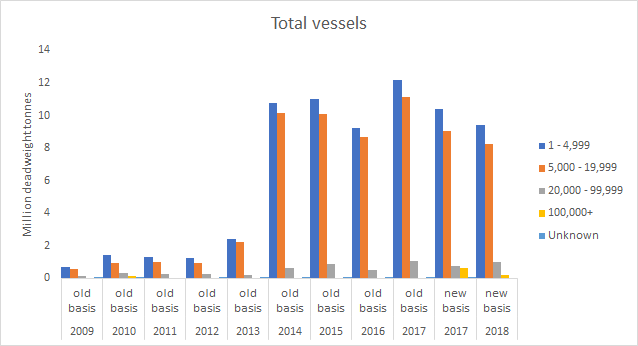
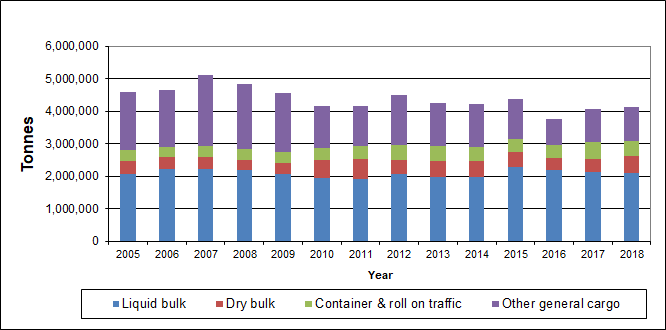
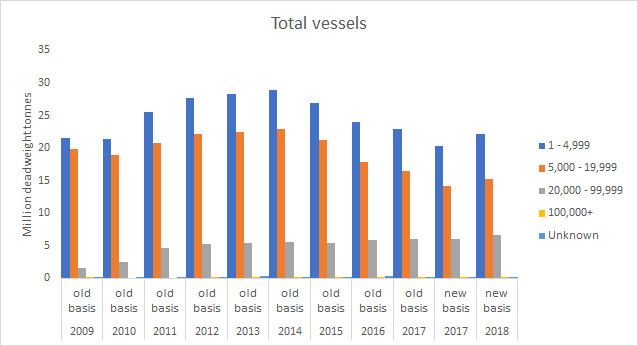
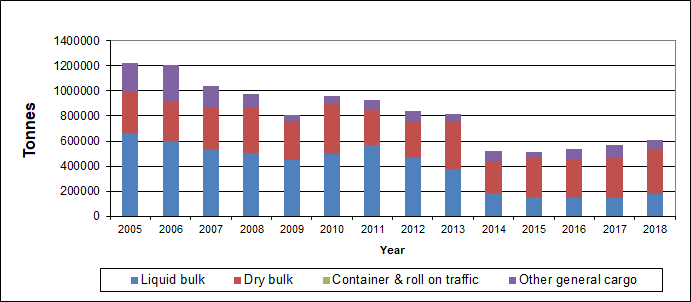
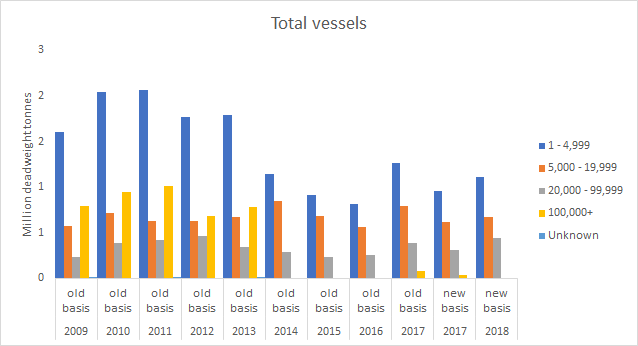
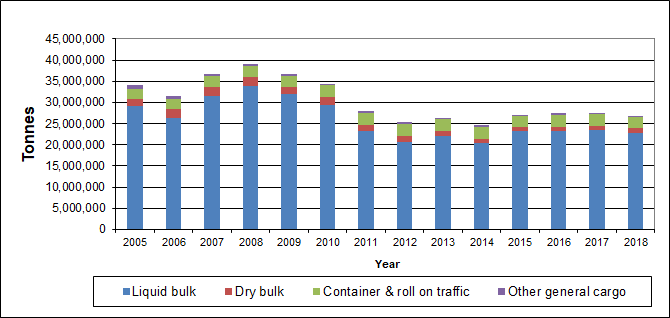
Figure a shows the tonnage by cargo type for each of Scotland’s 11 major ports alongside the total deadweight tonnage of vessels arriving by various vessel sizes, both for the period 2009-2018. Figure b, as an example, shows for Forth ports the vessel arrival numbers, by vessel type and deadweight range, again for the period 2009 to 2018. Further similar graphs for the major and other ports are available on the Transport Scotland web site under the heading ‘Datasets’. These graphs show the variety or domination of traffic and vessel type and the associated trends at the named port.
Stranraer / Loch Ryan (Solway SMR)
Cairnryan (Solway SMR)
Clyde (Clyde SMR)
Glensanda (Argyll MR)
Orkney (Orkney Islands SMR)
Sullom Voe (Shetland Isles SMR)
Cromarty Firth (Moray Firth SMR)
Peterhead (North East SMR)
Aberdeen (North East SMR)
Dundee (Forth and Tay SMR)
Forth (Forth and Tay SMR)
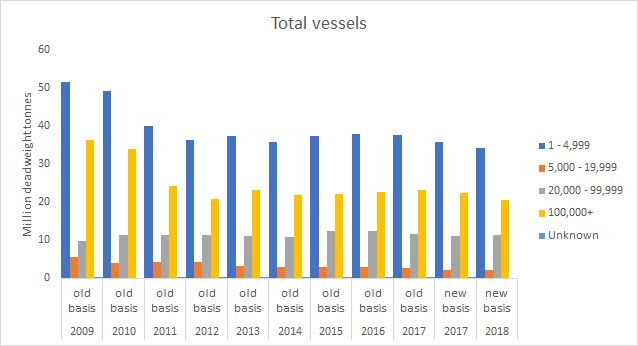
Figure a: Tonnage by cargo type (2005-2018) and Total deadweight tonnage of vessels arriving by various vessel sizes (2009-2018) at Scotland’s 11 major ports. Source: Scottish Transport Statistics (Transport Scotland, 2020) and Department for Transport maritime and shipping statistics.
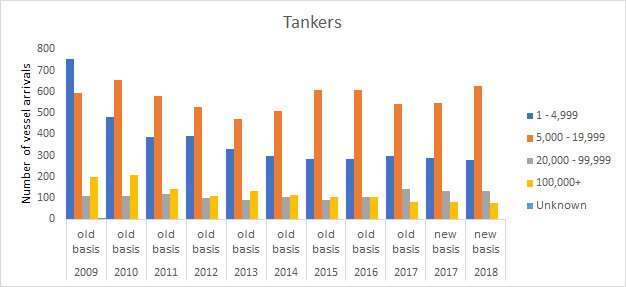
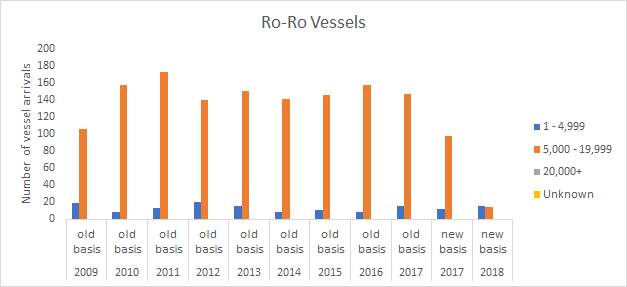
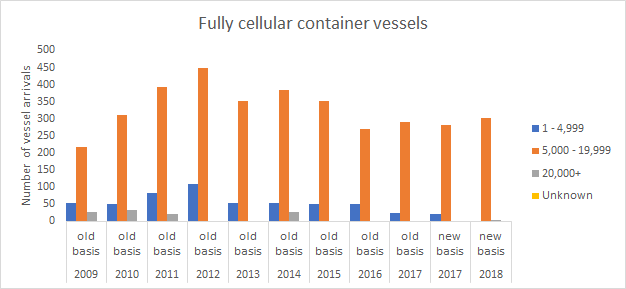

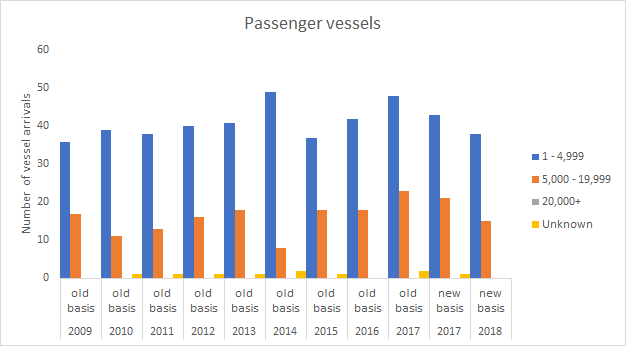
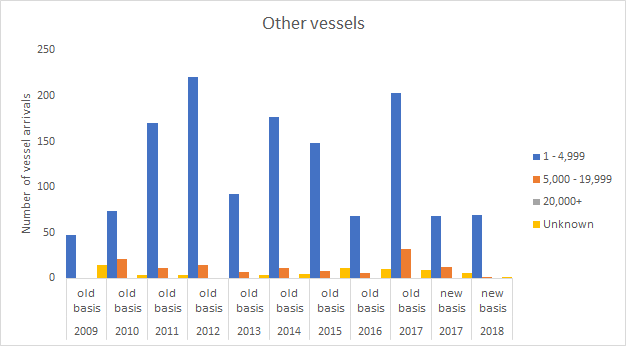
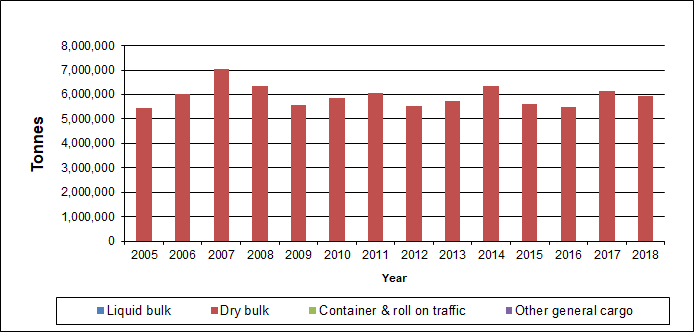
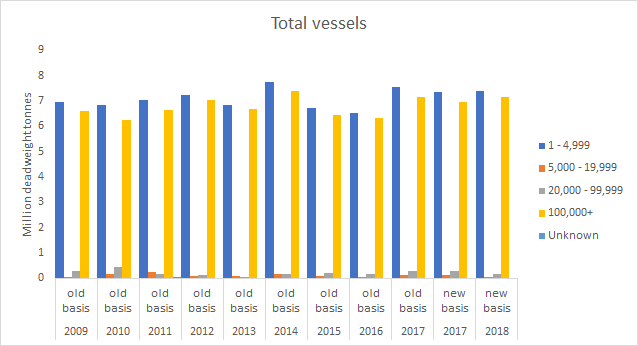
Figure b: Forth ports: vessel arrival numbers, by vessel type and deadweight range, 2009 to 2018. Source: Scottish Transport Statistics (Transport Scotland, 2020) and Department for Transport maritime and shipping statistics.


Vessel activity around the coast is further demonstrated by data collected from the Maritime and Coastguard Agency’s AIS ship position data collection. Figure e shows data of average weekly density of shipping traffic covering 2013 - 2017 for all vessel types. MS Maps NMPi includes separate data layers for the various vessel types: cargo; vessels engaged in dredging or underwater operations; fishing vessels; high speed craft; military or law enforcement vessels; non-port service craft; passenger vessels; port service craft; recreational vessels; tankers. Figure f elaborates the differences between traffic densities of 2012 and 2017, source data for these years being open to such comparison.


Ship-to-ship oil transfers are an important contribution to the logistics of the energy supply chain and take place at a few Scottish ports (Figure g).
 transfers in Scottish waters 2005-2018.")
Source: Marine Scotland, Marine Scotland Information.
Maritime services
A report on Global Maritime Professional Services (PwC (2016)) cites Glasgow as having one of the key locations outside London for Professional Services – “Glasgow is particularly strong in cadet training as well as ship management”. Leading training organisations include City of Glasgow College, Clyde Group and Babcock International, as well as the Royal Navy’s own training capability in Faslane. Ship management has several key players in Scotland, including Anglo-Eastern, Norbulk Shipping, Northern Marine Ltd, V-Ships and Songa Ship Management, with the concentration in Glasgow considered the leading ship management cluster in Europe. Scotland also has a number of universities with global leadership positions in maritime, especially Strathclyde, Heriot Watt and Robert Gordon universities.
Shipbuilding
The top three local authority areas in Scottish shipbuilding in 2017 (Glasgow City, Aberdeen City and Fife) accounted for 26% of the business sites, 78% of employment, 86% of turnover and 78% of GVA in the sector (Scottish Government, 2019). It is not possible to identify a full individual list of local authorities with shipbuilding activity for confidentiality reasons. Also see shipbuilding case study.
Aberdeen harbour development
Aberdeen Harbour Board’s £350 million expansion project has passed its halfway point in terms of construction. Due to open in 2021, the new South Harbour will be able to accommodate vessels of up to 300 metres in length, and will comprise 1,400 metres of new, deep-water quay, with water depths of up to 15 metres at highest tides. 125,000 square metres of laydown quayside will be created, with large zones incorporating heavy lift capacities of up to 15 tonnes per square metre.
The completion of development will make Aberdeen Harbour the largest port in Scotland in terms of berthage, and the construction project itself is the single biggest in Trust Port History. It is estimated that the new facilities will inject an additional £900 million into the national economy by 2035, creating an additional 7,000 equivalent full-time jobs.
This project is representative of investment in strategic infrastructure, providing an opportunity for economic growth across a wide range of sectors. The new facilities will have the ability to support developments in offshore energy sources, including the transition from carbon-based fuels to renewables activity in the North Sea. The port will also have capacity to support marine tourism, whilst maintaining the capacity to support developments in ferry operations to the Northern Isles.
Aberdeen Harbour Board has sought to adopt environmental best practice. The South Harbour design provides the operational flexibility to support developments in alternative marine fuel sources and to act as a conduit for offshore power connections. The ability to divide the facility into segregated independent working zones could facilitate with future decommissioning activity (source, Aberdeen Harbour Board).

Contribution to the economy
The economic contribution of maritime freight, ports and shipping is measured in two different industry groups; ‘freight water transport’ and ‘construction of water projects and water transport service activities’. Freight water transport includes transport of freight overseas and coastal waters. Construction of water projects and water transport service activities includes:
- Construction and operation of waterways, harbours, pleasure ports (marinas), locks, etc.
- dredging of waterways
- activities related to water transport of passengers, animals or freight
- navigation, pilotage and berthing activities
- lighterage (the transference of cargo by means of a lighter), salvage activities
- lighthouse activities
Freight water transport
In 2017 freight water transport generated £45 million Gross Value Added (GVA) and provided employment for around 500 people (headcount).
Between 2013 and 2017 the GVA from freight water transport (adjusted to 2017 prices) fell by 42%, while the longer term trend from 2008 to 2017 showed that freight water transport GVA fell by 70%. GVA reached a peak of £192 million in 2011, falling to £45 million in 2017. From 2008 to 2017, employment fell by 29%, from a high of 900 people in 2014 to 500 in 2017.
. Source: Scotland’s Marine Economic Statistics, Scottish Government (2019).")
Construction of water projects and water transport service activities
Scotland’s Marine Economic Statistics (SMES) (Scottish Government, 2019) report on the industry categories of ‘Construction of water projects’ and ‘Service activities incidental to water transportation’. In 2017, construction and water transport services contributed £591 million in GVA and provided employment for 4,300 workers. Between 2013 and 2017, GVA increased by 8%, while employment rose by 10%. The longer term trends have been variable, but generally increasing. Between 2008 and 2017 construction and water transport services GVA increased by 83% and employment increased by 65%.
. Source: Scotland’s Marine Economic Statistics, Scottish Government (2019).")
Shipbuilding
In 2017, the GVA contribution from the Scottish shipbuilding sector was around £0.6 billion, whilst turnover stood at £1.6 billion. Shipbuilding provided employment for 7,700 people (headcount) (Scottish Government, 2019). Scottish shipbuilding accounted for a fairly significant proportion of total UK output of the industry (around 29% for turnover and 24% for GVA in 2017). See ship building case study.
Maritime sector
A 2019 Centre for Economics and Business Research (Cebr) report for Scottish Maritime Cluster (Cebr, 2019) showed that in 2017 the Scottish Maritime sector, encompassing Shipping, Ports, Marine and Maritime Business Services was reported to have contributed business turnover of £9.9 billion, GVA of £3.7 billion and provided employment of over 41,000 jobs.
Maritime sector
While SMES considers direct impacts of passenger and freight transport, and of shipbuilding, the Cebr report (Cebr, 2019) aimed to capture the full economic footprint of the wider Scottish Maritime sector by including assessments of the associated indirect and induced multiplier impacts of a range of maritime industries.
Cebr defined the Maritime sector as consisting of the Shipping, Ports, Marine and Maritime Business Services industries. Each of these entities comprises a multitude of different activities.
Their analysis showed that in 2017 (the latest data available at the time) the Maritime sector made a substantive contribution to the Scottish and UK economies through business turnover, Gross Value Added (GVA), employment and through the compensation of employees. It was estimated that the Maritime sector directly supported just under £9.9 billion in turnover, £3.7 billion in GVA and 41,000 jobs in Scotland in 2017. As a proportion of the UK-wide Maritime sector in 2017, this equated to approximately 21% of turnover, 27% of GVA and 19% of employment. Scotland therefore accounted for approximately one-fifth of the UK Maritime sector by these measures of economic activity (and one-quarter in the case of GVA).
With a large proportion of employment in the Marine Oil and Gas activities concentrated in Scotland, the marine engineering and scientific industry was the largest constituent industry within the Scottish Maritime sector in terms of economic activity, directly contributing £2.5 billion in GVA and directly supporting around 29,000 jobs in 2017. This compared to £860 million and £220 million in GVA directly contributed by the Shipping and Ports industries respectively in Scotland.
To provide a time series of marine freight transport, the port tonnages through Scotland’s 11 major ports over the latest five years has been analysed.
|
Scottish Marine Region
|
Major Ports
|
Tonnage in 2018 (thousand tonnes)
|
Change in tonnage 2014– 2018
(thousand tonnes)
|
% change
|
|
Argyll
|
Glensanda
|
5,943
|
-404
|
-6%
|
|
Clyde
|
Clyde
|
9,087
|
-7,114
|
-44%
|
|
Forth and Tay
|
Dundee, Forth
|
27,195
|
2,070
|
8%
|
|
Moray Firth
|
Cromarty Firth
|
275
|
-1,316
|
-83%
|
|
North East
|
Aberdeen, Peterhead
|
5,269
|
-339
|
-6%
|
|
Orkney Islands
|
Orkney
|
3,470
|
2,319
|
201%
|
|
Shetland Isles
|
Sullom Voe
|
5,329
|
-1,856
|
-26%
|
|
Solway
|
Cairnryan, Loch Ryan
|
5,403
|
997
|
23%
|
|
All Scottish ports
|
|
65,083
|
-6,298
|
-9%
|
Examples of socio-economic effects
- Sea transport of goods remains environmentally beneficial.
- Sector is a significant economic contributor.
- Societal benefits enable the movement of people, goods and services to and from island and remote communities, improving connectivity.
- Provides infrastructure and support for offshore industries.
- Ports might have to compete with other land users which may limit their development and economic contribution.
Pressures on the environment
An OSPAR agreed list of marine pressures is used to help assessments of human activities in the marine environment. The marine pressure list has been adapted for use in Scotland via work on the Feature Activity Sensitivity Tool (FeAST). Maritime transport (freight, ports & shipping) activities can be associated with 27 marine pressures – please read the pressure descriptions and benchmarks for further detail.
The list of marine pressures is used to help standardise assessments of activities on the marine environment, and is adapted from an agreed list prepared by OSPAR Intercessional Correspondence Group on Cumulative Effects (ICG-C) (see OSPAR 2014-02 ‘OSPAR Joint Assessment and Monitoring Programme (JAMP) 2014-2021’ Update 2018’ (Table II).
The Feature Activity Sensitivity Tool (FeAST) uses the marine pressure list to allow users to investigate the sensitivity of Scottish marine features. It also associates all pressures that might be exerted by a defined list of activities at a particular benchmark. The extent and impact of each pressure from a given activity will vary according to its intensity or frequency. The extent and impact of the pressure will also vary depending on the sensitivity of the habitat or species on which it is acting. The existence of multiple activities, and potentially multiple pressures, at specific locations will result in a cumulative impact on the environment.
FeAST is a developing tool. A snap shot from 2019 was used for the development of SMA2020. Please consult the FeAST webpage for further information and up to date information.
The list of pressures below associated with this activity is given in alphabetical order. Clicking the pressure will give you more information on the pressure and examples of how it may be associated with the activity.
Forward look
The Scottish Government has developed a strategy to create a positive environment for Scottish maritime businesses and institutions to grow and prosper within a competitive international market.
The ports operate as commercial businesses, and continue to adapt and develop to meet the demand of the maritime industry. They are identifying the need for new development to support the various sectors using them. Some examples are:
- the largest trust port investment in the UK will see the Aberdeen South Harbour completed and open for business in 2021.
- a new fish market is being built in Lerwick with boats expected to start landing into the new facility in 2020.
- development of an ultra-deep water port at Dales Voe in Lerwick is aimed at bringing the largest decommissioning projects to Scotland.
- Stornoway is in the process of developing a new multifunctional deep water berth which will accommodate the largest cruise vessels as well as general cargo, renewables industry, oil & gas and ferry infrastructure. It is scheduled to open in 2021.
Scottish Government recognises the impact the maritime sector has on the environment, and is working with shipbuilding industries at the forefront of devising technology advances to increase ship efficiency and create cleaner solutions.
Economic trend assessment
Trends for Scotland are based on Freight Port tonnages for all ports in Scotland, 2014-2018. Although information on Gross Value Added (GVA) for freight transport is available, this is only at a Scotland level and does not include 2018 data. Therefore a decision was made to focus on tonnage for all of the trends. This does not affect the direction of the trend as the GVA for freight water transport decreased by 48% between 2014 and 2017.
Trends for Scottish Marine Regions are based on Freight Port tonnages (2014-2018) for Scotland's 11 major ports.
Confidence is three stars as based on published national statistics.
|
Scottish Marine Region |
|
|
Argyll |
|
|
Clyde |
|
|
Forth and Tay |
|
|
Moray Firth |
|
|
North East |
|
|
Orkney Islands |
|
|
Shetland Isles |
|
|
Solway |
|
|
Scotland |
|
This Legend block contains the key for the status and trend assessment, the confidence assessment and the assessment regions (SMRs and OMRs or other regions used). More information on the various regions used in SMA2020 is available on the Assessment processes and methods page.
Status and trend assessment
|
Status assessment
(for Clean and safe, Healthy and biologically diverse assessments)
|
Trend assessment
(for Clean and safe, Healthy and biologically diverse and Productive assessments)
|
||
|---|---|---|---|
 |
Many concerns |
No / little change |
|
 |
Some concerns |
Increasing |
|
 |
Few or no concerns |
Decreasing |
|
 |
Few or no concerns, but some local concerns |
No trend discernible |
|
 |
Few or no concerns, but many local concerns |
All trends | |
 |
Some concerns, but many local concerns |
||
 |
Lack of evidence / robust assessment criteria |
||
| Lack of regional evidence / robust assessment criteria, but no or few concerns for some local areas | |||
 |
Lack of regional evidence / robust assessment criteria, but some concerns for some local areas | ||
| Lack of regional evidence / robust assessment criteria, but many concerns for some local areas | |||
Confidence assessment
|
Symbol |
Confidence rating |
|---|---|
|
Low |
|
|
Medium |
|
|
High |

Assessment regions
 and the Scottish Offshore Marine Regions (OMRs, O1 – O10)")
Key: S1, Forth and Tay; S2, North East; S3, Moray Firth; S4 Orkney Islands, S5, Shetland Isles; S6, North Coast; S7, West Highlands; S8, Outer Hebrides; S9, Argyll; S10, Clyde; S11, Solway; O1, Long Forties, O2, Fladen and Moray Firth Offshore; O3, East Shetland Shelf; O4, North and West Shetland Shelf; O5, Faroe-Shetland Channel; O6, North Scotland Shelf; O7, Hebrides Shelf; O8, Bailey; O9, Rockall; O10, Hatton.
 Regions. These have been used as the assessment areas for hazardous substances.")
, Regions.")