


What, why and where?
Marine tourism covers a wide range of activities including: walking/ hiking/ running, beach activities, photography, yachting/ sailing, swimming, wildlife tourism, diving, kayaking, angling, surfing, visitor attractions and increasingly, cruise ship visits. Much of the sector relies on people taking part in activities in places where they are freely permitted: for example sailing where there is freedom of navigation and walking where there is suitable access (paths, beaches etc.). As a result gathering spatial data to locate activity is not straightforward.
Economic figures show that marine tourism accounted for around 14% of all tourism in 2017. While figures from the study of Scottish residents found that the vast majority (89%) of the Scottish public surveyed have visited the Scottish sea or coast in the past year. (Scottish Government, 2020).
The Scottish Marine Recreation Tourism Survey (SMRTS) (Scottish Government, 2016) was commissioned to inform the National Marine Plan (Scottish Government, 2015). It provided marine planners, the tourism industry and potential investors with information about 23 different recreation and tourism activities undertaken at sea and around the coastline.
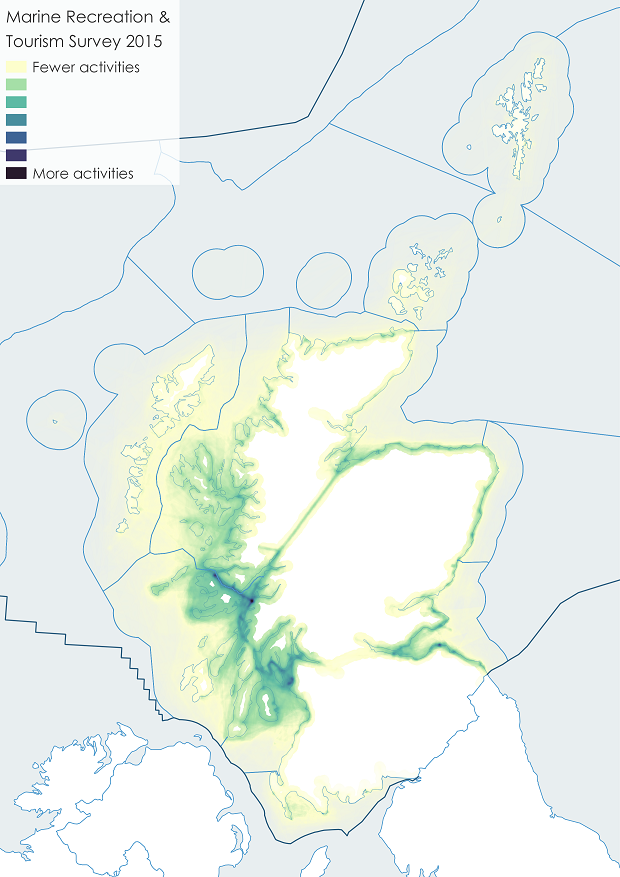
Figure 1: Marine recreation and Tourism Survey 2015 - All activities combined (showing Scottish Marine Regions and Offshore Marine Regions). Darker colouring shows areas of higher activity.
Source: Scottish Marine and Recreation Tourism Survey (Scottish Government, 2016).
The survey encompassed many types of tourism, with differing levels of response and activity. So the results are helpful to identify busy areas and activities with confidence, although less busy areas or activities are reported with less confidence. A nil response to the survey does not mean nil activity.

Scottish Government has designated 2020 the Year of Coasts and Waters. The importance of marine and coastal tourism was a key driver in this designation.
The Scottish Marine Recreation Tourism Survey (SMRTS) report (Scottish Government, 2016) gathered spatial data from over 2,500 respondents and provided improved awareness of what takes place where.
The study notes that ‘survey design and method for data collection means the survey results are not representative of all marine recreation and tourism activities in Scotland, particularly in more remote areas, and information on activities with fewer participants is not to be taken as an indication that no activity takes place’. As such the spatial data from SMRTS are helpful but not definitive.
In 2015 the Marine Tourism Development Group (MTDG) published ‘Awakening the Giant – the Marine Tourism Strategy 2015’ which was then revisited in 2018 (MTDG, 2015; MTDG, 2018). The strategy was an industry-led strategy to maximise the potential of Marine Tourism in Scotland. Both the original strategy and the following review set out an ambition for growth, with sailing identified as the largest of the activities within the sector. A key strand of the work was the development of adequate facilities to accommodate growth and changing leisure patterns.
A new strategy ‘Giant Strides’ is currently under development and is expected to be produced in 2020.
Yachting / sailing
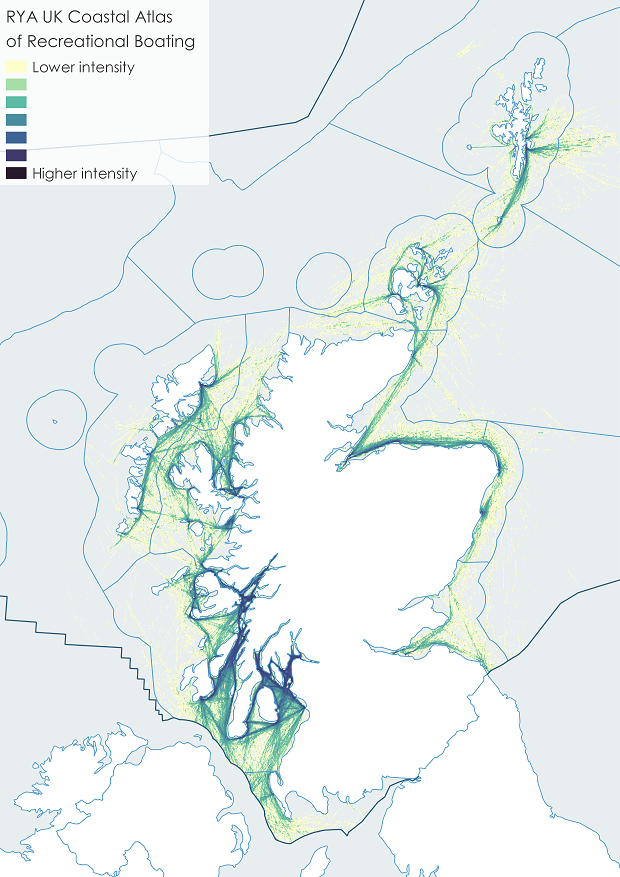
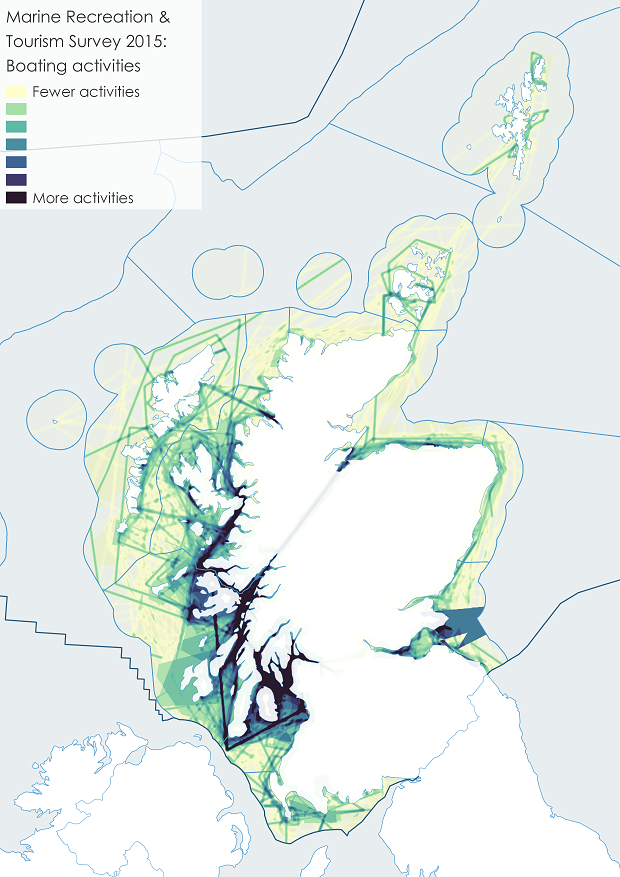
The Royal Yachting Association’s (RYA) ‘Coastal Atlas of Recreational Boating’ (RYA, 2019) included an update on recreational use intensity, based on location records from AIS (Automatic Identification System). AIS provides information about a vessel carrying the system to other vessels and to coastal authorities automatically. Figure a (left) shows the location of recreational boating activity based on the RYA information with Figure a (right) taken from the SMRTS report, and self-reported locations from the SMRTS sample. The AIS data are reasonably representative inshore but become less reliable away from the coast. It should also be noted that not all recreational craft carry AIS. What is apparent is that sailing is concentrated in the Clyde and along the west coast.
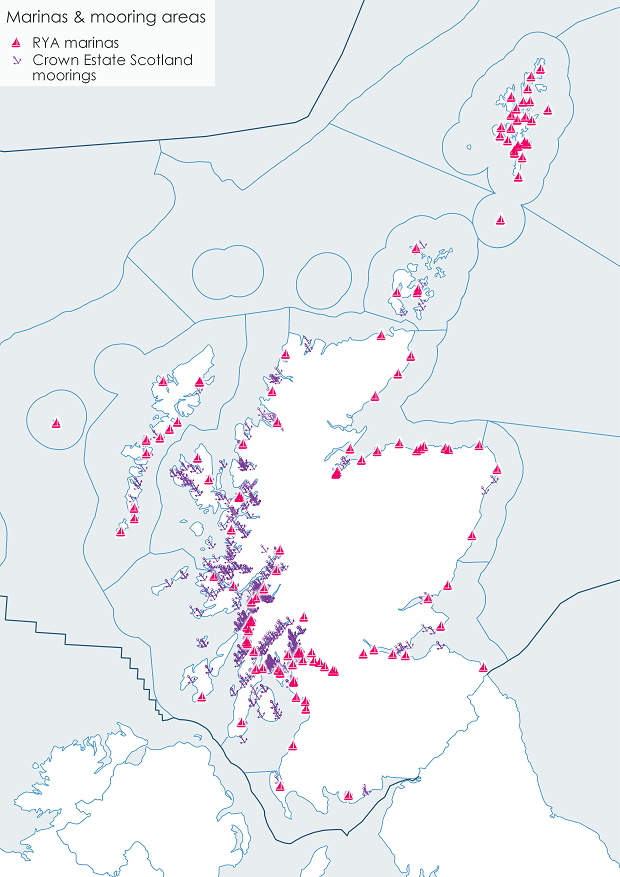
Sailing is particularly dependent upon the range of available infrastructure: there are a number of marinas, harbours offering pontoon berths and dedicated mooring areas around Scotland (Figure b).
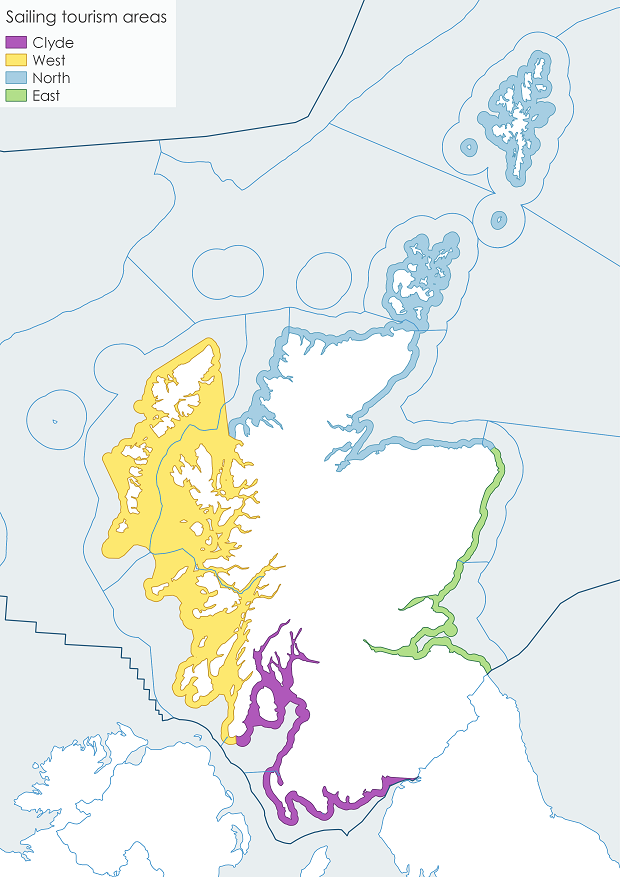
The Sailing Tourism in Scotland Report (EKOS, 2016) for The Crown Estate, Highlands and Islands Enterprise and Scottish Canals updated the earlier Sailing Tourism in Scotland Report (2010) for Scottish Enterprise. It undertook economic analysis and growth projections of the Sailing Tourism sector in Scotland and identified strategic development areas around the coastline. The study divided Scotland into four main areas – Clyde, West, North and East (Figure c) which are considered to reflect the geography of the main ‘sub national’ sailing economies.
The 2016 report showed that the total supply was approximately 15,700 berths in 2016 (pontoons and moorings for both residents and visitors) up from 12,600 in 2009, an increase of 25% (Table a). Of these 13,500 are resident berths (up 23%) and 2,200 visitor berths (up 32%). Occupancy of resident berths is 95% which is the same level as in 2009, so demand had kept pace with supply. Nearly three quarters of the capacity (73%) is located in the West and Clyde regions (Table b). Facility improvement and expansion is constantly changing and so such figures can only ever be a snapshot. Since the data were collected in 2016 there have been further investments in marina berths and facilities, for example improved facilities at Tarbert on Loch Fyne and Port Edgar, and pontoons at Lochboisdale and Oban.
|
Area
|
Total Resident* and Visitor** Berths 2009
|
Total Resident* and Visitor** Berths 2016
|
Change 2009 - 2016
|
% change in Resident* & Visitor** Berths
|
|
Clyde (Solway & Clyde SMRs)
|
5,371
|
6,437
|
1,066
|
20%
|
|
West (Argyll, Outer Hebrides & part West Highland SMRs)
|
3,667
|
5,021
|
1,354
|
37%
|
|
North (part West Highland, Orkney Islands, Shetland Isles, Moray Firth (SMRs)
|
2,016
|
2,618
|
602
|
30%
|
|
East (North East, Forth & Tay SMRs)
|
1,547
|
1,617
|
70
|
5%
|
|
Total
|
12,601
|
15,693
|
3,092
|
25%
|
|
Area
|
Pontoons
|
Moorings
|
Total
|
Proportion of Total Available Berths
|
|
Clyde (Solway and Clyde SMRs)
|
3,735
|
2,702
|
6,437
|
41%
|
|
West (Argyll, Outer Hebrides and part West Highland SMRs)
|
1,332
|
3,689
|
5,021
|
32%
|
|
North (part West Highland, Orkney Islands, Shetland Isles, Moray Firth (SMRs)
|
2,003
|
615
|
2,618
|
17%
|
|
East (North East, Forth and Tay SMRs)
|
1,112
|
505
|
1,617
|
10%
|
|
Total
|
8,182
|
7,511
|
15,693
|
100%
|
The Awakening the Giant Strategy (MTDG, 2015) set out an ambition for growth of sailing as a major part of Marine Tourism. It identified that an additional 3,000 berthing facilities were required to fully realise the potential demand. It is not known yet how the awaited ‘Giant Strides’ strategy due in 2020 may change this figure.
Wildlife tourism
Coastal and marine wildlife tourism attracts visitors to view, study and/or enjoy wildlife on the coast. This includes viewing birds, mammals and coastal habitats from boats or from land vantage points with an emphasis on cliff nesting seabirds or seals at haul-out sites (where seals haul themselves out of the water).
Marine wildlife tourism specialist operators provide access to offshore areas and certain marine species, for example, dolphins, porpoises, basking sharks and seals. The Scottish Marine Wildlife Watching Code (revised in 2017) (SNH, 2017a) is supplemented by the Guide to Best Practice for Watching Marine Wildlife (SNH, 2017b) to help minimise any disturbance to marine life and stay within the law. There is also a network of land based aquaria and marine wildlife centres, Table c.
|
Scottish Marine Region
|
Aquaria and marine wildlife centres
|
|
Forth and Tay
|
St Abbs Visitor Centre,
Scottish Seabird Centre,
Deep Sea World,
St Andrews Aquarium,
Montrose Basin
|
|
Moray Firth
|
Scottish Dolphin Centre
Macduff Aquarium
|
|
Orkney
|
Orkney Marine Life Aquarium
|
|
Shetland
|
Fair Isle Bird Observatory,
Sumburgh Head Lighthouse
|
|
West Highland
|
Gairloch Marine Life Centre
|
|
Argyll
|
Ocean Explorer Centre,
Mull Aquarium,
Hebridean Whale and Dolphin Trust
|
|
Clyde
|
Robertson Museum and Aquarium,
Loch Lomond Sea Life Aquarium
|
|
Solway
|
Logan Fishpond Marine Life Centre
|
Cruise ships
The growing cruise ship industry is another important part of the leisure and recreation sector. Between 2010 and 2018 the number of cruise ship visits has more than doubled (Table d). More details are included in the maritime transport section of the assessment.
|
Type of call
|
2010
|
2011
|
2012
|
2013
|
2014
|
2015
|
2016
|
2017
|
2018
|
|
Transit calls
|
342
|
348
|
393
|
403
|
406
|
450
|
586
|
658
|
755
|
|
Turnaround calls
|
27
|
33
|
53
|
51
|
51
|
51
|
90
|
104
|
70
|
|
Total number of ships calling into port
|
369
|
381
|
446
|
454
|
457
|
501
|
676
|
762
|
825
|
Research into the cruise sector is ongoing.
Visitor attractions
The Moffat Centre for Travel & Tourism Business Development (Glasgow Caledonian University) creates a regular visitor attraction monitor report (by subscription) based on survey returns from participating attractions. The data from ‘Coastal attractions’, defined as being located within approximately one mile of the coast, reveals that the Clyde and Forth & Tay Scottish Marine Regions (SMR) have the largest visitor numbers (Figure d).

The results in the monitor survey show that (of those who responded to the survey in each of the last three years, and are ‘Coastal attractions’) museums and art galleries represent 45% of visits in 2018. Outdoors and nature attractions were the second most popular at 12% of visits in 2018 (see Table e). Findings from the Moffat Centre monitor are also shown in the Historic Environment and Cultural Heritage assessment.
|
Attraction type
|
Visits 2018
|
2018 % of total visits
|
|
Museums/ Art Galleries
|
6,672,659
|
45%
|
|
Outdoors/Nature Attractions
|
1,772,454
|
12%
|
|
Gardens
|
1,194,495
|
8%
|
|
Castles/Forts
|
990,940
|
7%
|
|
Other Historic Properties
|
805,464
|
5%
|
|
Places of Worship/ Spiritual Attractions
|
778,925
|
5%
|
|
Historic Houses/Palaces
|
694,585
|
5%
|
|
Wildlife/Animal Attractions
|
653,877
|
4%
|
|
Heritage Centres
|
460,024
|
3%
|
|
Distilleries/ Breweries/ Wineries
|
331,176
|
2%
|
|
Activity Attractions
|
134,375
|
1%
|
|
Transport-Related Attractions
|
127,846
|
1%
|
|
Scottish Crafts/Retail Attractions
|
48,058
|
0%
|
|
Industrial /Workplaces
|
22,644
|
0%
|
|
Total
|
14,687,522
|
|
Bathing
In the 2019 bathing season there were 86 designated bathing waters, where SEPA monitors water quality from 15 May to 15 September and publishes the sampling results online (SEPA). Monitoring results of designated bathing waters is covered in the clean and safe, bathing water microbiology section. The 2019 classifications, calculated at the end of the 2018 bathing water season and applying to each bathing water for the duration of the 2019 season were:
| Excellent | 28 | (32%) |
| Good | 35 | (41%) |
| Sufficient | 13 | (15%) |
| Poor | 10 | (12%) |
In 2016 Keep Scotland Beautiful introduced Scotland's Beach Awards, assessed on 30 individual criteria points, replacing the earlier Blue Flag / Seaside Award. Table f details recent awards.
|
Scottish Marine Region
|
2016
|
2017
|
2018
|
2019
|
|
Forth and Tay
|
30
|
29
|
30
|
29
|
|
North East
|
8
|
8
|
8
|
8
|
|
Moray Firth
|
8
|
8
|
8
|
8
|
|
North Coast
|
3
|
3
|
3
|
3
|
|
Shetland
|
5
|
5
|
5
|
5
|
|
West Highland
|
1
|
1
|
1
|
1
|
|
Clyde
|
4
|
4
|
5
|
6
|
|
Total
|
59
|
58
|
60
|
60
|
Diving, canoeing, kayaking, angling and surfing
Diving on wrecks or offshore reefs is an important recreational activity particularly in Orkney and along the Berwickshire coast. A number of wrecks are protected (see Historic Environment & Cultural Heritage assessment).
The 168 respondents to the SMRTS survey who reported taking part in SCUBA diving identified over 2,000 locations where they had been. This information has been used to generate a heat map showing the concentration of SCUBA diving around the Scottish coast.
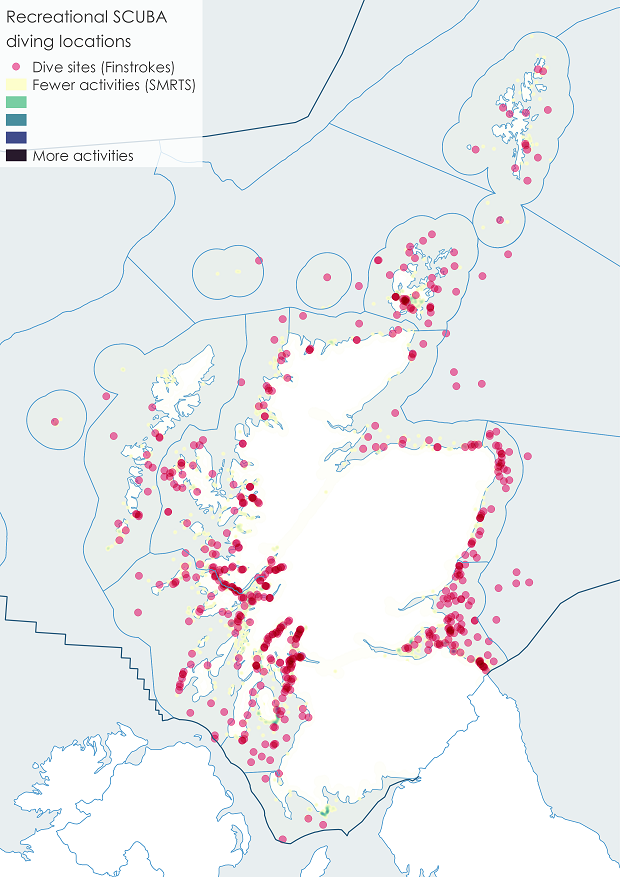
Figure e: Recreational SCUBA diving locations (showing Scottish Marine Regions and Offshore Marine Regions).
Source: SMRTS (Scottish Government, 2016) & Finstrokes.
Note: the pink circles are semi-transparent, so the dive sites points appear darker when they overlap the underlying ‘fewer / more activities’ SMRTS data.
Canoeing and kayaking take place around sea lochs and in coastal areas, especially on the west coast, while inland canals - the Crinan, Forth and Clyde, Union and Caledonian canals - not only provide transit routes between coastal areas but act as tourism destinations in their own right.
Sea angling
Sea angling is carried out from most regions of the coastline. A wide range of species are caught including cod, tope, bass, rays, pollack, mackerel and spurdog. Species caught vary from region to region and at different times of the year. Information about the capture of some fish is covered in the Salmon and Sea Trout Fishing part of the assessment.
Surfing and windsurfing
Surfing and windsurfing take particular advantage of the Atlantic waves breaking off the Inner Hebrides but surfing is also popular on the east coast.

See West Coast Waters & North Coast 500: two examples of marine and coastal related tourism initiatives
Marine Social Attitudes survey
A study on Scottish resident’s attitudes (Scottish Government, 2020) towards the marine environment found that women in particular as well as residents living in coastal areas are more likely to go walking, do beach activities, or wildlife watch along the coast than men or those who do not live near the coast. Many residents mentioned that while they enjoy using the marine environment for leisure they would like to see better facilities available, such as clean, working toilets, availability of drinking water, and better walkways and access for people with buggies or wheelchairs. The study also found that many have concerns over the negative impact of tourism, particularly in terms of people polluting and littering. Evidence suggests while residents generally consider tourism a good thing, many say that it must be well managed in order to ensure the costs do not outweigh the benefits to Scotland’s marine environment.

Contribution to the economy
Marine tourism generated £594 million Gross Value Added (GVA) and employment for 28,300 people in 2017 (Scottish Government, 2019). This represents 14% of the £4.1 billion GVA from all Scottish tourism. GVA is the value of goods and services produced minus the cost of raw materials and other inputs used to produce them. Marine tourism employment figures account for 38% of employment in the Scottish marine economy (excluding oil and gas extraction). However these figures are headcounts and do not take account of the seasonal and part-time nature of employment in marine tourism.
From 2014 to 2017, the GVA from marine tourism (adjusted to 2017 prices) increased by 2%, while the longer term trend from 2008 to 2017 (Figure 3) showed that marine tourism GVA increased by 28%. From 2014 to 2017 employment increased by 6%, while the longer term trend, from 2008 to 2017, showed a 16% increase.
, 2008 to 2017 (adjusted to 2017 prices).")
Source: Scotland’s Marine Economic Statistics. (Scottish Government, 2019).
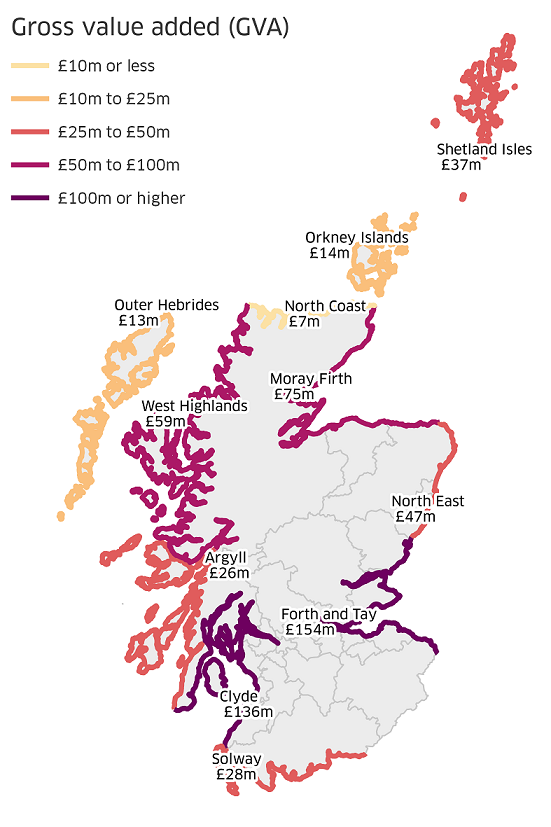
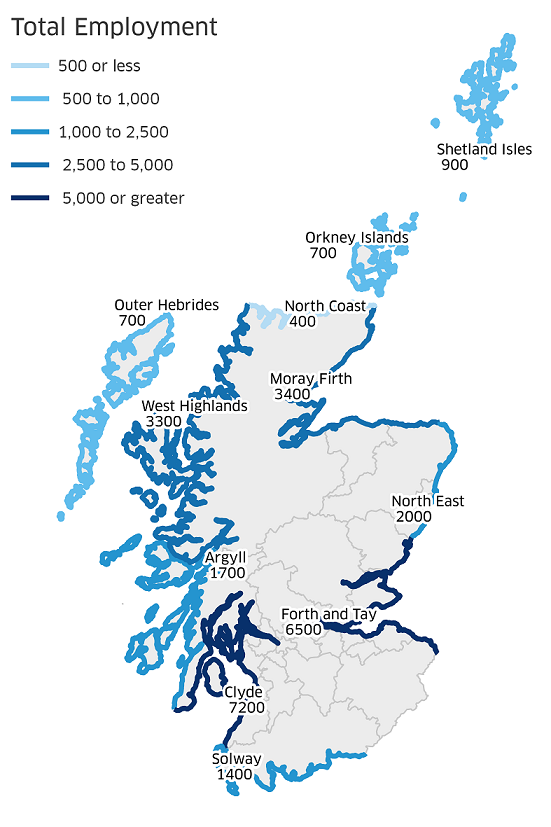
Economic values for leisure and tourism can be provided by Scottish Marine Region (SMR) (see Table g, in ‘Read More’ section). Information by local authority is unavailable due to the small number of responses for some areas and the need to protect the confidentiality of individual businesses. While SMRs are geographies that relate to the sea, marine tourism is earned on land and so the figure shows outputs around the coast.
The Sailing Tourism in Scotland report (EKOS, 2016), concluded that Scotland’s sailing tourism economy is worth £130 million and supports 2,700 jobs.
The Forth and Tay region was the largest contributor to marine tourism GVA in 2017 at £154 million (26% of the GVA), while the Clyde region contributed 7,200 jobs, (26% of the employment), which was slightly higher than the Forth and Tay.
The methodology used in the Marine Economic Statistics (Scottish Government, 2019) for the leisure and recreation builds on the methodology developed as part of the Scottish Marine Recreation Tourism Survey (SMRTS) report (Scottish Government, 2016).
Marine tourism and recreation has been defined as including “activities which involve travel away from one’s “habitual” place of residence, which have as their host or focus the marine environment and/or the coastal zone”. It was assumed that all tourism businesses located in postcodes within 100 metres of the coastline were engaging in marine tourism and recreation or dependent on the marine environment. While this assumption may not be strictly accurate (includes some businesses that are not marine-related, and not include some that are marine-related) it provides a reasonable and replicable method of estimating marine tourism and recreation businesses with existing data.
The industry categories (from Scotland’s Annual Business Survey) that are included are:
- Hotels and similar accommodation.
- Holiday and other short-stay accommodation.
- Camping grounds, recreational vehicle parks and trailer parks.
- Restaurants and mobile food service activities.
- Beverage serving activities.
- Tour operator activities.
- Other reservation service and related activities.
- Museum activities.
- Operation of historical sites and buildings and similar visitor attractions.
- Botanical and zoological gardens and nature reserve activities.
- Operation of sports facilities.
- Other sports activities (not including activities of racehorse owners).
- Activities of amusement parks and theme parks.
- Other amusement and recreation activities.
Table g shows the marine tourism contribution to GVA by SMR and how that has changed since 2014 (the first reported marine tourism GVA). The source for the marine tourism GVA figures is the Scottish Annual Business Survey (SABS). This is a sample survey, so more detailed breakdowns of the data will result in reduced statistical quality. In particular, when the data are disaggregated to SMR, small changes can have a have a very marked effect on figures from one year to the next. The SMR marine tourism GVA trend arrow is derived from the % change and any change less than or equal to 5% is included in ‘No change’. Trend arrows are not calculated on small values (GVA of less than 20 million in 2017) due to the volatility of the sample. This direction of travel is used for the trend assessment. The 2017 value allows the individual SMR value to be put into context with marine tourism as a whole.
|
Scottish Marine Region
|
2017 GVA
£ million |
Difference 2014 to 2017
(2017 prices) GVA |
||
|
£ M
|
%
|
|
||
|
Argyll
|
26.2
|
-9.1
|
-26%
|
↓
|
|
Clyde
|
136.4
|
-13
|
-9%
|
↓
|
|
Forth and Tay
|
153.8
|
37.3
|
32%
|
↑
|
|
Moray Firth
|
74.5
|
9.3
|
14%
|
↑
|
|
North Coast
|
6.5
|
0
|
0%
|
|
|
North East
|
46.7
|
-1.3
|
-3%
|
↔
|
|
Orkney Islands
|
13.6
|
5.2
|
63%
|
|
|
Outer Hebrides
|
12.7
|
-22.1
|
-64%
|
|
|
Shetland Isles
|
37
|
19.7
|
114%
|
↑
|
|
Solway
|
27.7
|
-7
|
-20%
|
↓
|
|
West Highlands
|
59
|
-5.1
|
-8%
|
↓
|
|
Total
|
594
|
13.8
|
2%
|
↔
|
Examples of socio-economic effects
- Contributes to a healthier, happier nation.
- Contributes to the economy, drives inclusive growth and underpins supply chains.
- Provides employment in rural and coastal locations.
- Major events (e.g. West Highland Yachting Week and Tiree Wave Classic) give coastal communities a distinct and global profile.
- Seasonal nature not as robust as non-seasonal industries.
- Vulnerable to economic downturns.
- Activities can compete for space.
Pressures on the environment
An OSPAR agreed list of marine pressures is used to help assessments of human activities in the marine environment. The marine pressure list has been adapted for use in Scotland via work on the Feature Activity Sensitivity Tool (FeAST). Leisure and recreation activities can be associated with 13 marine pressures – please read the pressure descriptions and benchmarks for further detail.
The list of marine pressures is used to help standardise assessments of activities on the marine environment, and is adapted from an agreed list prepared by OSPAR Intercessional Correspondence Group on Cumulative Effects (ICG-C) (see OSPAR 2014-02 ‘OSPAR Joint Assessment and Monitoring Programme (JAMP) 2014-2021’ Update 2018’ (Table II).
The Feature Activity Sensitivity Tool (FeAST) uses the marine pressure list to allow users to investigate the sensitivity of Scottish marine features. It also associates all pressures that might be exerted by a defined list of activities at a particular benchmark. The extent and impact of each pressure from a given activity will vary according to its intensity or frequency. The extent and impact of the pressure will also vary depending on the sensitivity of the habitat or species on which it is acting. The existence of multiple activities, and potentially multiple pressures, at specific locations will result in a cumulative impact on the environment.
FeAST is a developing tool. A snap shot from 2019 was used for the development of SMA2020. Please consult the FeAST webpage for further information and up to date information.
The list of pressures below associated with this activity is given in alphabetical order. Clicking the pressure will give you more information on the pressure and examples of how it may be associated with the activity.
Forward look
The Year of Coasts and Waters 2020 will focus attention on Scotland’s seas and coasts.
Marine and coastal tourism also features as a key sector in other Scottish Government work, such as City Deals, regeneration projects such as that currently being undertaken in North Ayrshire and the wider Programme for Government Commitment to develop the South of Scotland as a tourism destination. The effect of the Themed Year and other initiatives will be evaluated in appropriate data in future years.
The SMRTS 2015 survey highlighted the importance of good environmental conditions and abundant marine wildlife to marine tourists and particularly to many recreational boaters. The joint British Marine and RYA initiative The Green Blue, a website that promotes sustainable boating for cleaner and healthier waters, has been reinvigorated (2019) and RYA has been working with NatureScot to minimise any adverse effects of recreational boating on Priority Marine Features.
The cruise ship industry is expected to continue to expand. The industry is confident that 1 million passengers a year will occur either in 2019 or 2020. A study (Cruise Scotland, 2010), when 248,923 visitors arrived, forecast 830,000 passengers by 2025, so growth continues ahead of expectations.
The Year of Coasts and Waters 2020 will focus attention on Scotland’s seas and coasts based around four themes:
- Our Natural Environment & Wildlife.
- Our Historic Environment & Cultural Heritage.
- Activities & Adventure.
- Food & Drink.
The broad scope of the Themed Year will highlight the social, rural, environmental and economic policies and projects in development across the Scottish Government and wider public sector.
In response to the growing switch away from hydrocarbon fuel, there may be more vessels with electrical propulsion but the nature of this technology is still unclear. It is not yet clear to what extent the effects of climate change and the disposal of end-of-life boats is being considered by recreational boaters.
Under two scenarios the Sailing Tourism in Scotland Report (EKOS, 2016) indicated potential growth for the 4 sailing areas (Table h).
|
Area*
|
Current Supply
|
Scenario A
(most likely)
|
% Growth
|
Scenario B
(more optimistic)
|
% Growth
|
|
Clyde
|
6,437
|
1,310
|
20%
|
1,620
|
25%
|
|
West
|
5,021
|
785
|
16%
|
1,000
|
20%
|
|
North
|
2,618
|
320
|
12%
|
430
|
17%
|
|
East
|
1,617
|
760
|
47%
|
820
|
51%
|
|
Total
|
15,693
|
3,175
|
20%
|
3,870
|
25%
|
The report noted that a lack of facilities in the East had constrained a growth in demand, which could be satisfied over a longer timeframe by the proposed future developments at Dundee and Granton.
Work has started on a new 75 berth marina at Newton, Stornoway, the first phase of a 20-year plan. The Outer Hebrides is already a key sailing destination for visitors, and Stornoway is an important link in a chain of marinas stretching from the Butt of Lewis to the Isle of Barra.
Economic trend assessment
GVA from marine tourism in Scotland has increased from £580 M in 2014 to £594 in 2017 (2017 prices) an increase of 2% (2014 is used as the base line to remain consistent with the earliest that the disaggregated SMR data for marine tourism is available).
National trend
Scottish Marine Region trends are based on GVA at 2017 prices. The % change in GVA is reported. Changes of less than 5% are considered as not substantial changes. In addition, trend arrows are not calculated on small values (GVA of less the 20 million in 2017) due to the volatility of the source Scottish Annual Business Statistics sample data. Confidence is three stars as based on published national statistics. The detailed table of results is shown as Table g in the Extended economic section above.
|
Scottish Marine Region |
Trend assessment |
|
|
Argyll |
|
-25.9%
|
|
Clyde |
|
-8.7%
|
|
Forth & Tay |
|
32.0%
|
|
Moray Firth |
|
14.2%
|
|
North East |
|
-2.7%
|
|
Shetland Isles |
|
114.5%
|
|
Solway |
|
-20.2%
|
|
West Highlands |
|
-7.9% |
This Legend block contains the key for the status and trend assessment, the confidence assessment and the assessment regions (SMRs and OMRs or other regions used). More information on the various regions used in SMA2020 is available on the Assessment processes and methods page.
Status and trend assessment
|
Status assessment
(for Clean and safe, Healthy and biologically diverse assessments)
|
Trend assessment
(for Clean and safe, Healthy and biologically diverse and Productive assessments)
|
||
|---|---|---|---|
 |
Many concerns |
No / little change |
|
 |
Some concerns |
Increasing |
|
 |
Few or no concerns |
Decreasing |
|
 |
Few or no concerns, but some local concerns |
No trend discernible |
|
 |
Few or no concerns, but many local concerns |
All trends | |
 |
Some concerns, but many local concerns |
||
 |
Lack of evidence / robust assessment criteria |
||
| Lack of regional evidence / robust assessment criteria, but no or few concerns for some local areas | |||
 |
Lack of regional evidence / robust assessment criteria, but some concerns for some local areas | ||
| Lack of regional evidence / robust assessment criteria, but many concerns for some local areas | |||
Confidence assessment
|
Symbol |
Confidence rating |
|---|---|
|
Low |
|
|
Medium |
|
|
High |

Assessment regions
 and the Scottish Offshore Marine Regions (OMRs, O1 – O10)")
Key: S1, Forth and Tay; S2, North East; S3, Moray Firth; S4 Orkney Islands, S5, Shetland Isles; S6, North Coast; S7, West Highlands; S8, Outer Hebrides; S9, Argyll; S10, Clyde; S11, Solway; O1, Long Forties, O2, Fladen and Moray Firth Offshore; O3, East Shetland Shelf; O4, North and West Shetland Shelf; O5, Faroe-Shetland Channel; O6, North Scotland Shelf; O7, Hebrides Shelf; O8, Bailey; O9, Rockall; O10, Hatton.
 Regions. These have been used as the assessment areas for hazardous substances.")
, Regions.")