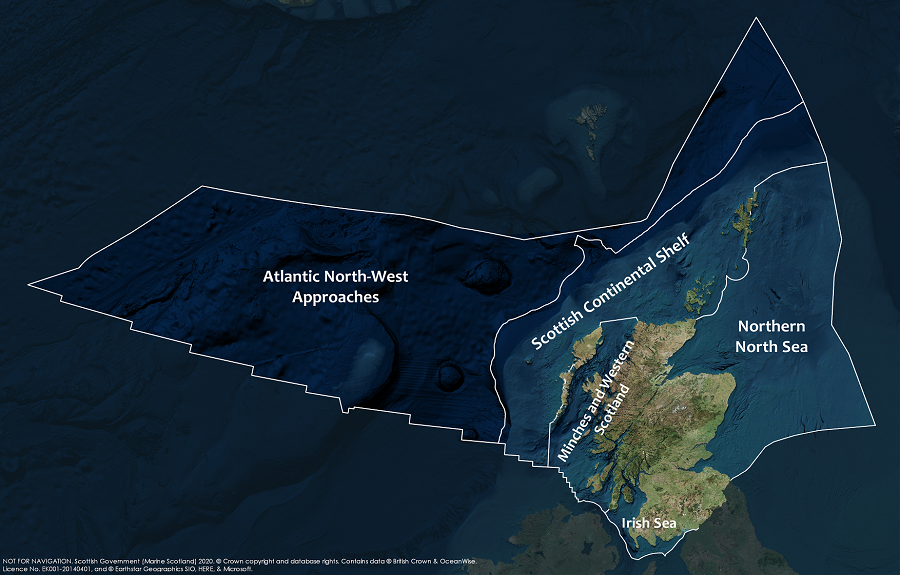
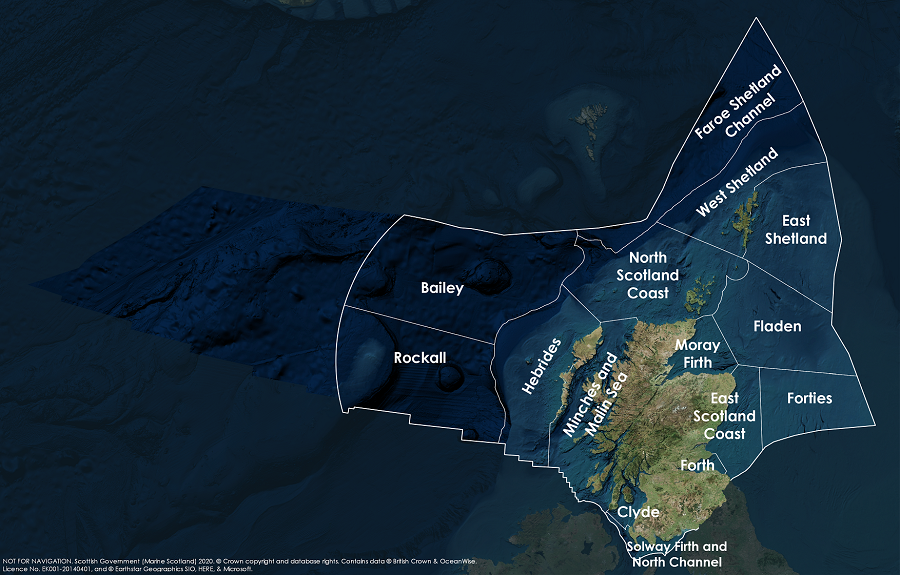
What, why and where?
Fishing within the Scottish part of the UK Exclusive Economic Zone (EEZ) is managed under the terms of the EU Common Fisheries Policy (CFP) although there are additional agreements for migratory stocks. Fishing can provide a sustainable source of nutritious, healthy food and its exploitation sustains many of Scotland’s most fragile rural coastal communities.
Fishing in Scottish waters is prosecuted by vessels from Scotland, other UK countries, EU member states, as well as other Coastal States e.g. Norway and Faroes. The vessels are often categorised into: the offshore fleet - those fishing for demersal (fin fish like haddock and cod, that are on or near the sea bed) and pelagic (fin fish like mackerel and herring, that are away from the sea bed and the shore) species, and the inshore fleet - those fishing for mainly for Nephrops (also known as Norway lobster, Dublin Bay prawn, langoustine or scampi) and shellfish.
All landings are reported based on sea area of capture and port of landing. Fish from Scottish waters can be landed at any UK or EU port. Statistics on landings are included in the annual Scottish Sea Fisheries Statistics (Scottish Government, 2019), although that excludes landings by non-UK vessels outside of the UK. In this assessment we are focussing on fish that are caught in Scottish waters regardless of whether they were caught by Scottish vessels or landed into Scotland. Figures from 2016 - 2018 show the tonnage of fish landed (fished within Scottish seas) has been relatively stable at around 490 thousand tonnes (Figure 1). This is larger than the 349 thousand tonnes landed in Scotland in 2018 (Figure 2).
There is a wealth of measures in place to manage fisheries. These include temporary closure of areas where juvenile fish are present in abundance, discard bans and technical restrictions on fishing gear and even complete fishing prohibitions for biologically sensitive areas (see Marine Protected Areas assessment).
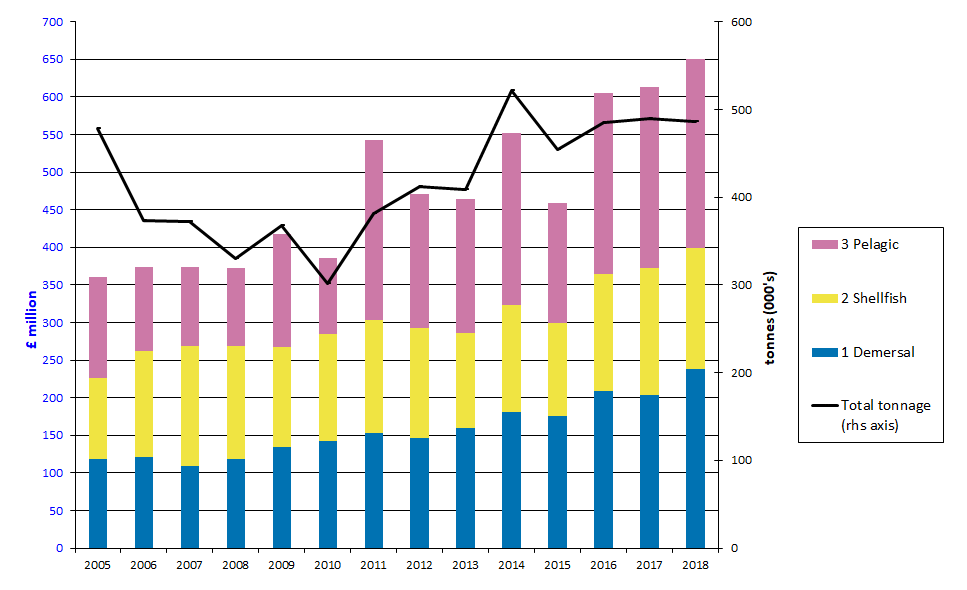
Figure 1: Landing value (cash prices) and tonnage of fish caught in all sea regions adjacent to Scotland by all UK vessels and by foreign vessels into the UK, 2005 to 2018.
Source: Marine Scotland, Scottish Sea Fisheries Statistics. Includes landings by all UK vessels and landings by foreign vessels into the UK. Excludes fish caught in Scottish sea areas by non-UK vessels and landed outside the UK.
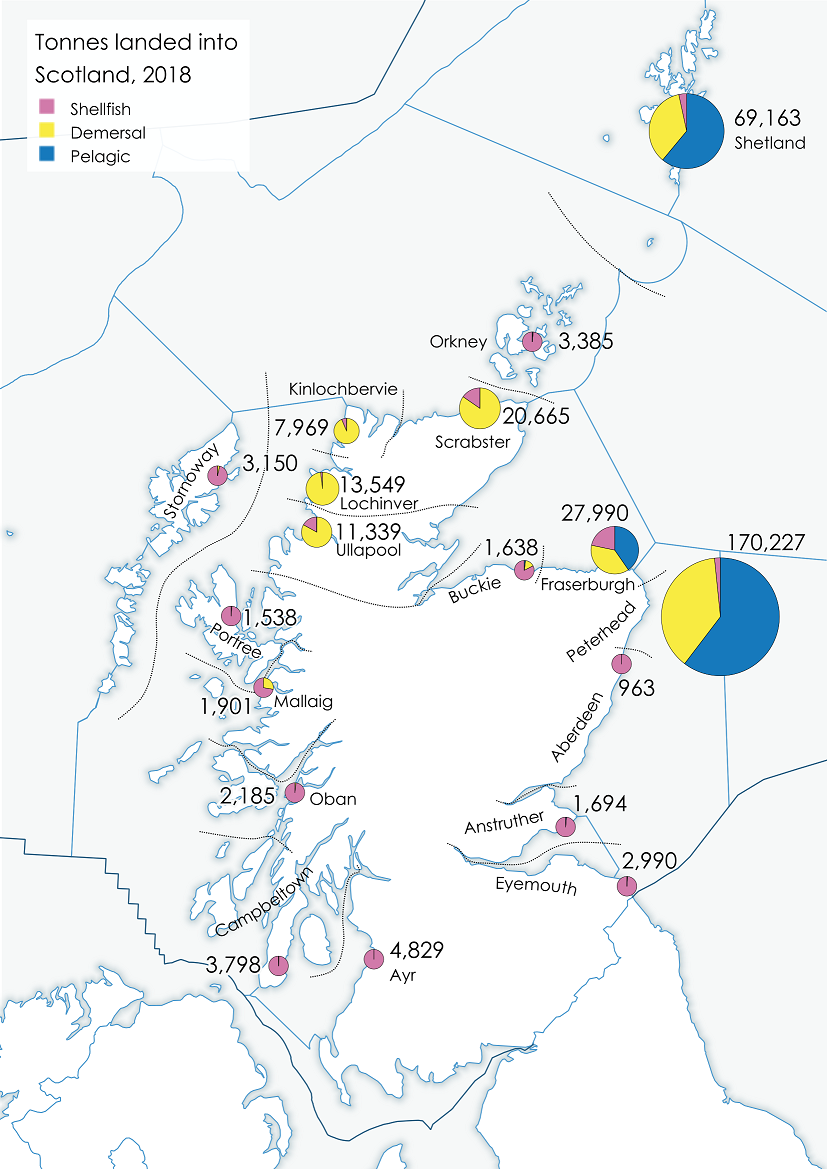
Figure 2: Tonnage landed into Scotland by all vessels by sea fishery district (black lines) and species type, 2018. Scottish Sea Areas (blue lines) added for context.
Source: Marine Scotland, Scottish Sea Fisheries Statistics (Scottish Government, 2019 a). Landings in this map includes fish caught outside Scottish waters.
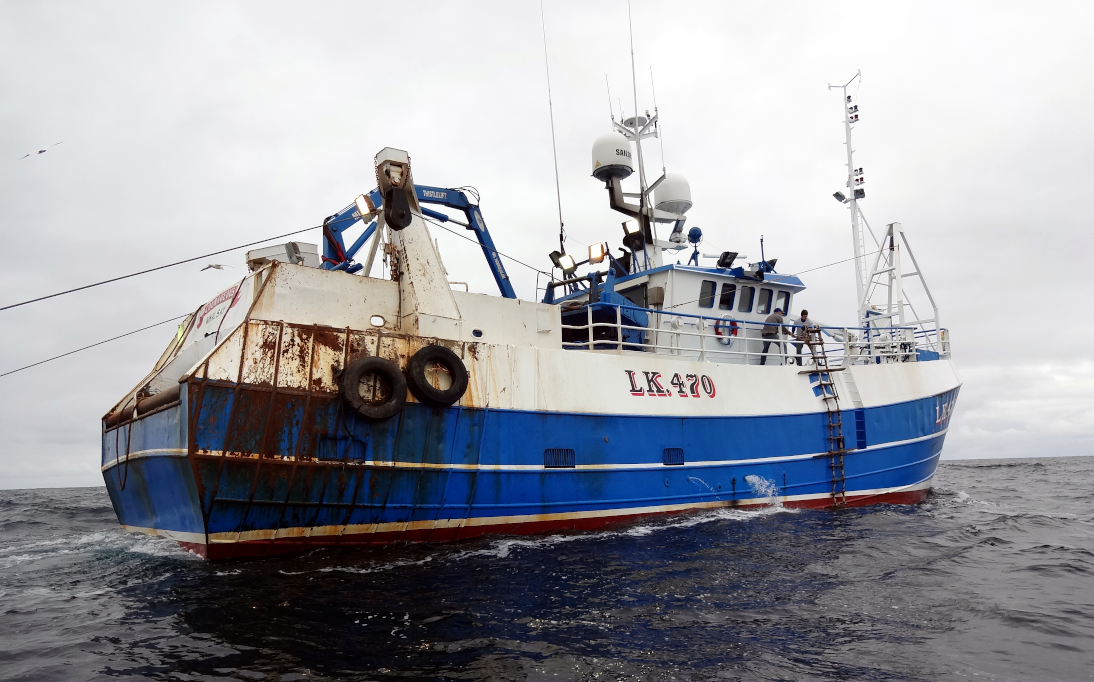
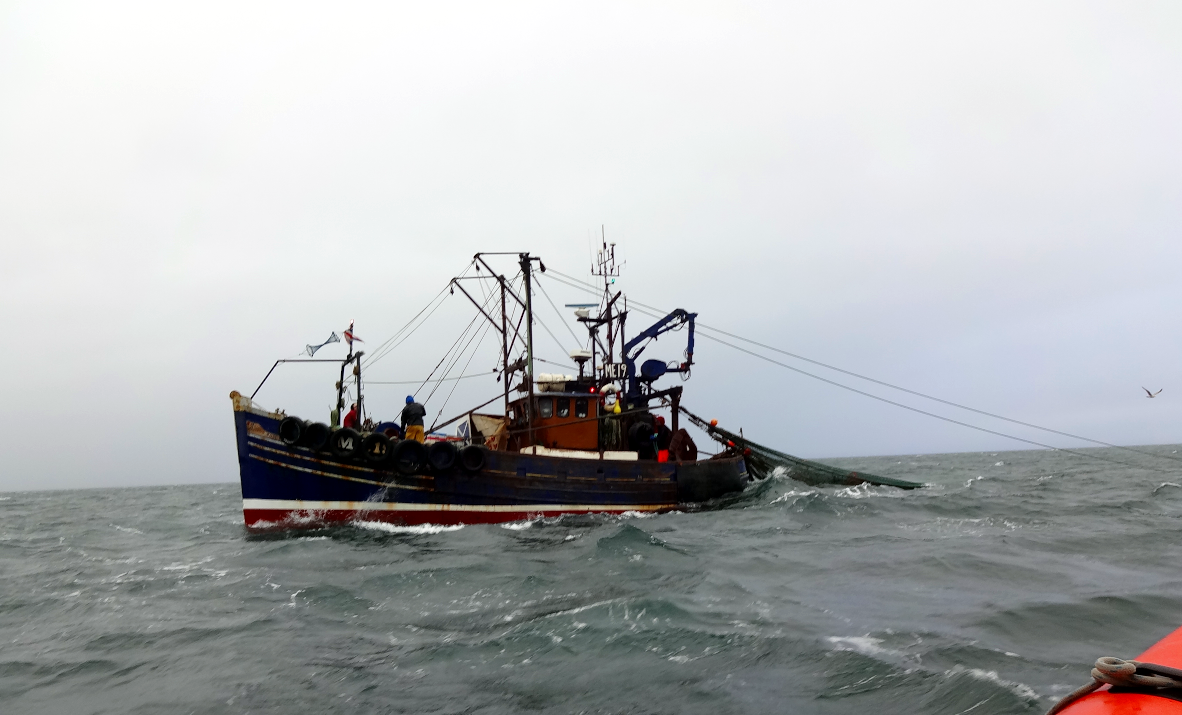
Figure 3: Shetland-registered demersal trawler towing in the North Sea. Photo by Stuart Bell, Marine Scotland.
Landings by catch location
As part of the assessment required to support the National Marine Plan, this assessment considers fish caught/ fishing in the EEZ by UK, EU and other coastal state vessels. However, it is acknowledged that Scottish fishermen also catch, and land in Scotland, fish caught outside that area.
All landings are reported according to the location in which they were caught. These are subdivided into large areas of sea known as ICES zones and smaller 30 by 30 nautical mile statistical rectangles (figures a, b and c show tonnages caught for these rectangles for 2014 - 2018 for demersal, pelagic and shell fish). The majority of vessels are also required to record the longitude and latitude of each fishing operation they carry out. In the case of vessels over 12 metres in length - which are required to be fitted with an electronic logbook, this is derived directly from the vessel’s Global Positioning System (GPS).
This catch information, together with independent fish surveys, form the basis of the data used to assess the amount of fish that can be caught each year. In Scottish waters all vessels of 12 metres and over are required to be fitted with an electronic Vessel Monitoring System (VMS) which allows for more detailed information about the location of fishing activity to be recorded. Smaller vessels are currently not covered by VMS and report their catches through paper-based logs.
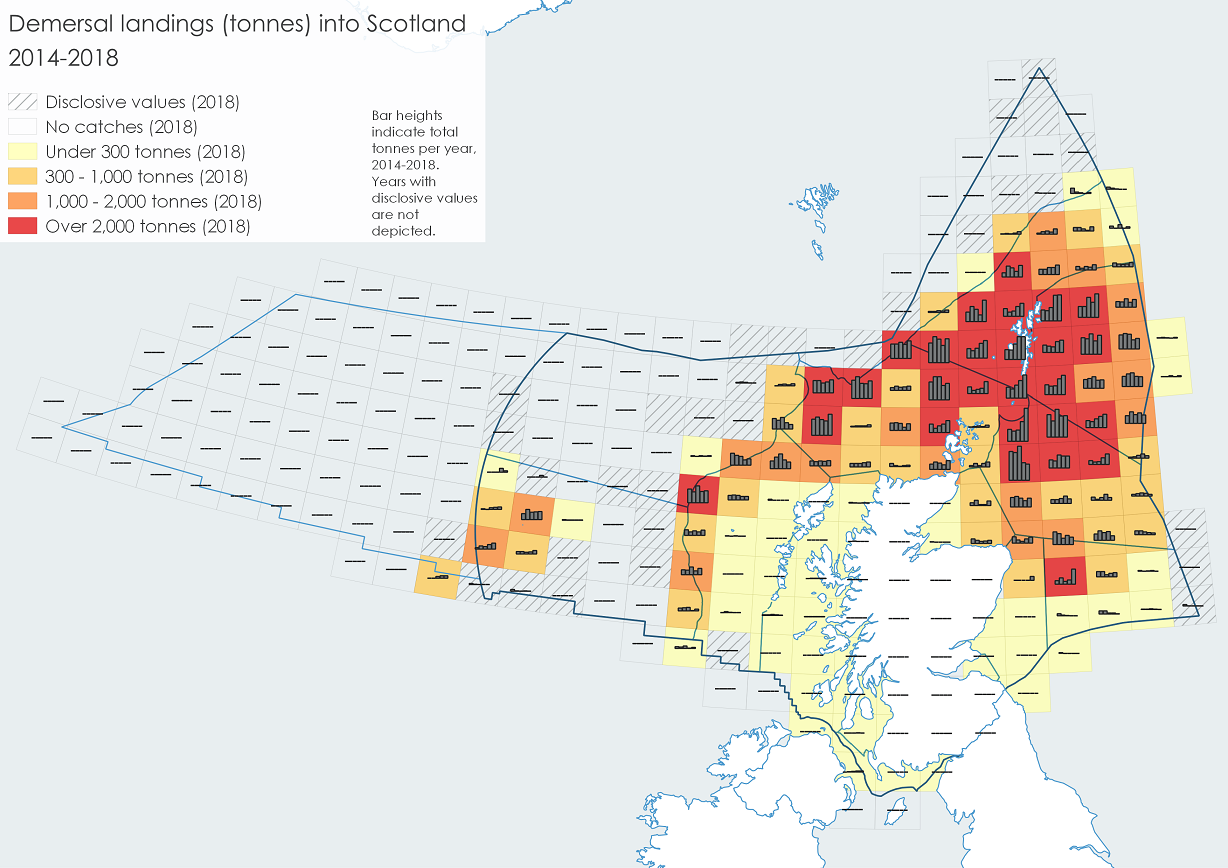
Figure a: Demersal landings (tonnes) from Scottish waters (per ICES statistical rectangle) 2014 - 2018.
Source: Marine Scotland. Note this map uses Scottish Sea Areas rather than Scottish Marine Regions / Offshore Marine Regions. Map can be accessed on Marine Scotland Maps NMPi (search ‘Fishing Statistics’) allowing user to zoom into the detail of the graphs.
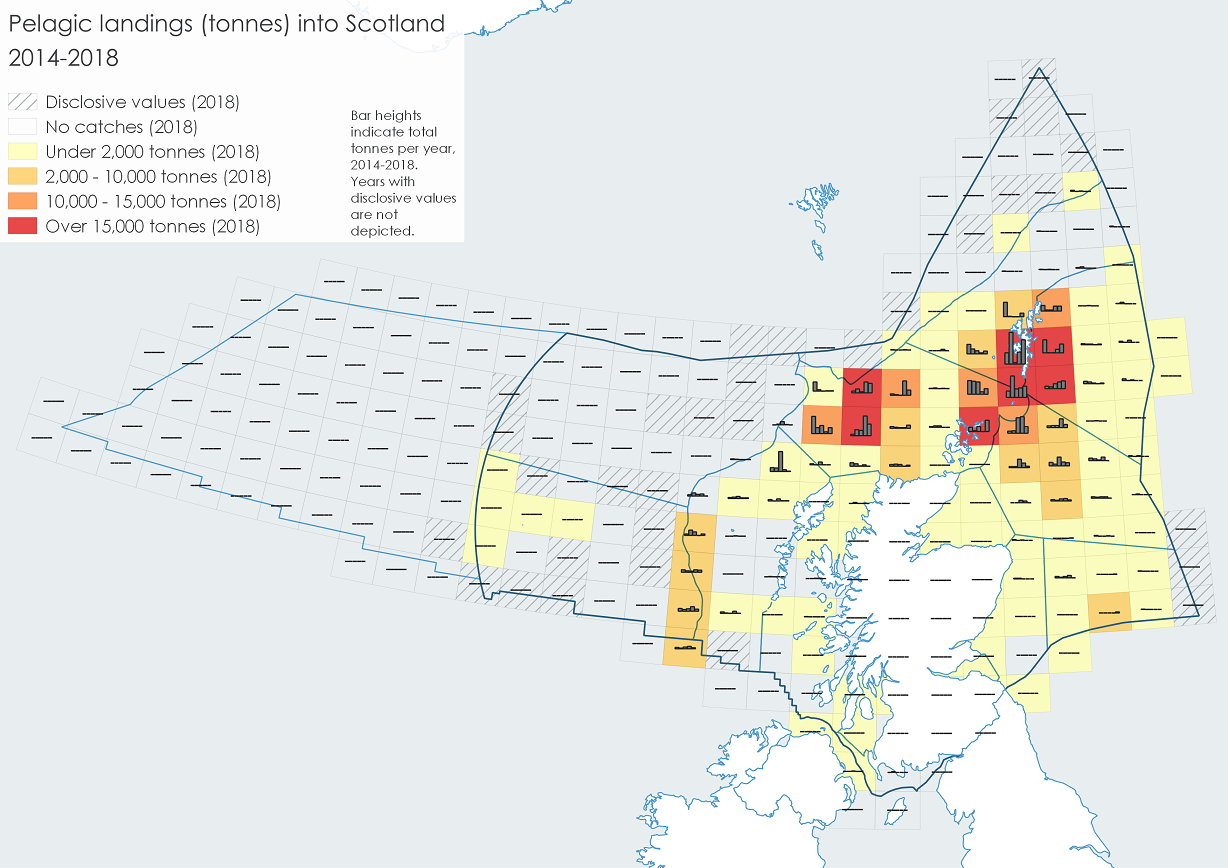
Figure b: Pelagic landings (tonnes) from Scottish waters (per ICES statistical rectangle) 2014 - 2018.
Source: Marine Scotland. Note this map uses Scottish Sea Areas rather than Scottish Marine Regions / Offshore Marine Regions. Map can be accessed on Marine Scotland Maps NMPi (search ‘Fishing Statistics’) allowing user to zoom into the detail of the graphs.
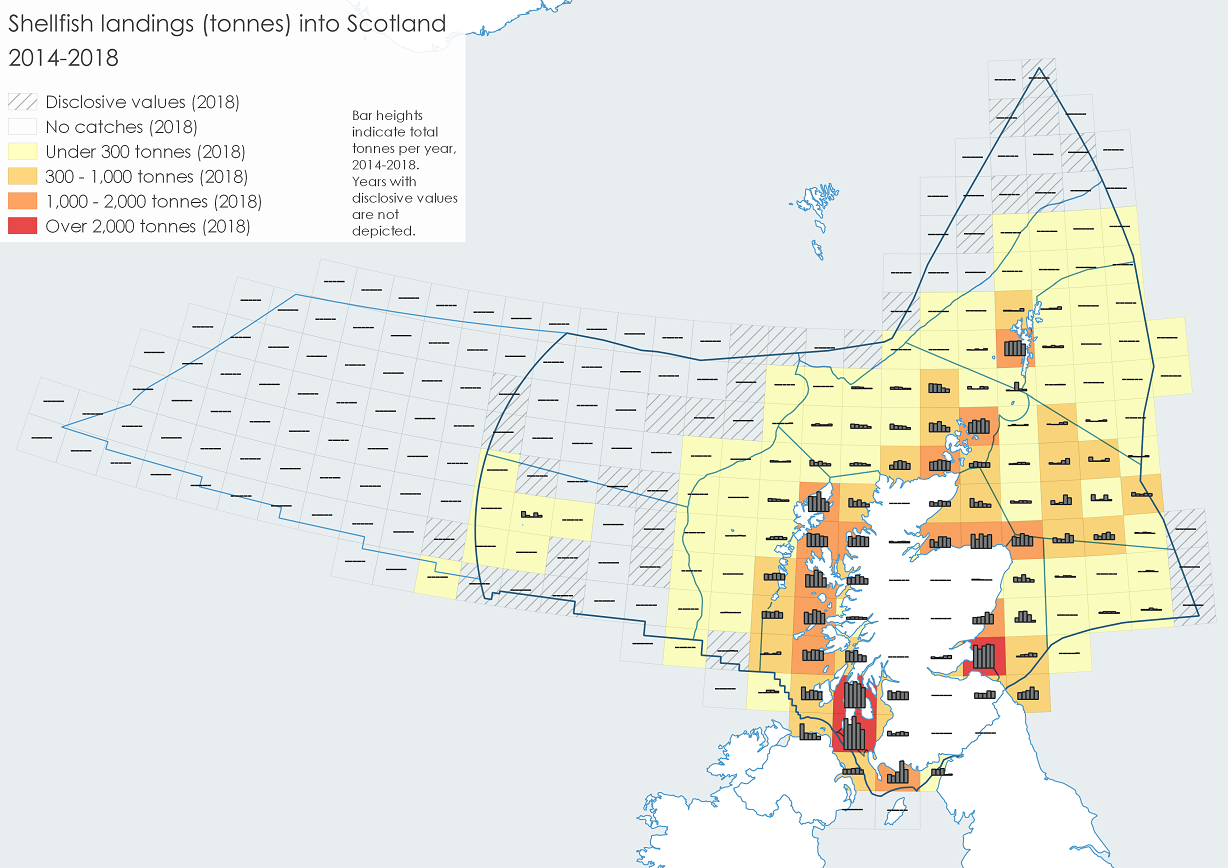
Figure c: Shellfish landings (tonnes) from Scottish waters (per ICES statistical rectangle) 2014 - 2018.
Source: Marine Scotland.
The bulk of catch from Scottish waters is made up of the following species: mackerel and herring (pelagic); haddock, cod and monkfish (demersal); Scottish langoustine (Nephrops); crabs and scallops (shellfish).
|
Live weight (000 tonnes)
|
|||||||||||
|
Species type
|
2008
|
2009
|
2010
|
2011
|
2012
|
2013
|
2014
|
2015
|
2016
|
2017
|
2018
|
|
1 Whitefish
|
85
|
95
|
90
|
90
|
94
|
108
|
109
|
109
|
117
|
110
|
138
|
|
2 Shellfish
|
60
|
63
|
63
|
58
|
59
|
52
|
54
|
46
|
57
|
55
|
46
|
|
3 Pelagic
|
184
|
211
|
149
|
233
|
259
|
249
|
358
|
299
|
311
|
324
|
302
|
|
Total tonnage
|
330
|
368
|
302
|
381
|
412
|
409
|
521
|
454
|
485
|
490
|
486
|
|
|
Value (£ million) in cash prices
|
||||||||||
|
|
2008
|
2009
|
2010
|
2011
|
2012
|
2013
|
2014
|
2015
|
2016
|
2017
|
2018
|
|
1 Whitefish
|
119
|
135
|
143
|
153
|
146
|
159
|
181
|
176
|
209
|
204
|
238
|
|
2 Shellfish
|
149
|
133
|
142
|
150
|
146
|
127
|
143
|
123
|
155
|
168
|
161
|
|
3 Pelagic
|
104
|
149
|
101
|
240
|
179
|
178
|
228
|
159
|
241
|
241
|
251
|
|
Total value
|
372
|
417
|
386
|
543
|
471
|
464
|
552
|
459
|
606
|
613
|
650
|
Scottish Fishing Fleet
Historically Scotland’s membership of the EU has meant shared access to community waters by fishing vessels of a variety of nationalities but the Scottish fishing fleet can be broadly characterised by four groups:
- The pelagic fleet mainly targets herring and mackerel, and tends to use large mid-water trawls. This fleet is comprised of a small number of large vessels, which retain their catch in refrigerated seawater tanks and land via pump-ashore systems. The pelagic fleet fishes in territorial waters and further from the coastline, including waters outside the EEZ.
- The demersal fleet targets bottom-dwelling fish in two types of fishery: one in the North Sea and to the west of Scotland (mainly cod, haddock, whiting, monkfish and saithe) and the other found in the deeper water to the north and west of Scotland (mainly hake and ling).
- The mixed demersal and shellfish fleet targets mainly Nephrops (prawn or langoustine) but also some demersal fish using a variety of gears. This section of the fleet also includes vessels that use mechanical dredges to target scallops. Though these vessels work predominantly inshore, they can also range beyond 12 nautical miles and tend to be fairly nomadic.
- The shellfish fleet is characterised mainly by vessels who use pots and creels to target crab, lobster and Nephrops in the inshore waters (out to 12 nautical miles). The majority are small (10 metres and under), working crews of between 1 and 3 persons.
Scottish Fishing Ports
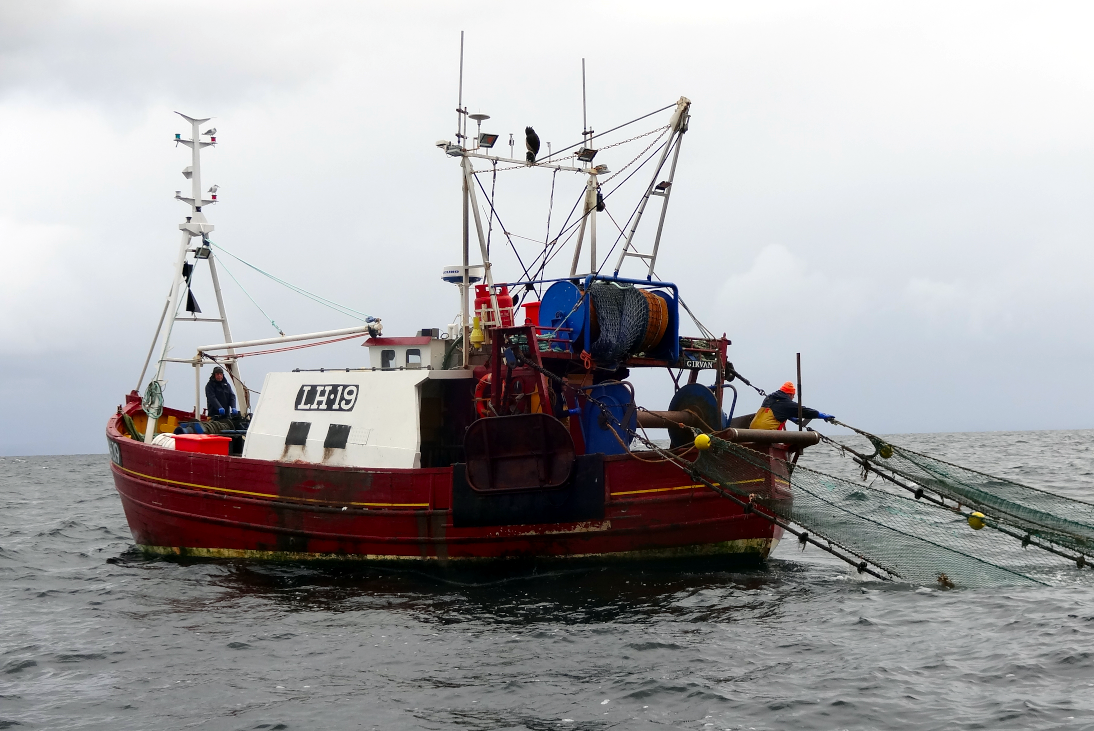
The heart of the commercial fishing industry lies in the north-east of Scotland, centred on Peterhead and Fraserburgh. This stretch of coastline has the greatest volume and value of landings, a dense concentration of fish processors (see Fish Processing assessment) and a high level of economic dependence on the fishing industry (see Case study: Overview of the marine economy).
The Shetland Islands sustain a fishing sector on a similar scale to that of north-east Scotland. Aside from its sizeable domestic fleet, its strategically important location amid the rich fishing grounds of the northern North Sea makes it a vital stop-off point for demersal and pelagic fishing boats from the UK, the EU and beyond.
The north coast and Orkney support localised, shellfish-dependent fisheries, although there are some busier ports, such as Scrabster, which see considerable landings of demersal fish species.
In the north-west, Lochinver and Kinlochbervie are important landing points for the fishing grounds to the north-west of Scotland. Aside from their domestic inshore fleets, they also receive significant landings from vessels from other EU countries – notably France and Spain - that operate extensively in those waters.
The west coast still supports numerous small but regionally important ports and harbours, such as Ullapool, Oban, Portree, Ayr, Kirkcudbright and Mallaig. Elsewhere, in the south-east and south-west, many small ports continue to sustain significant localised industry that is increasingly dependent on shellfish.
|
Local Authority
|
Total employed in fishing
|
|
Aberdeenshire
|
1,231
|
|
Highland
|
960
|
|
Argyll and Bute
|
496
|
|
Shetland
|
456
|
|
Na h-Eileanan Siar
|
303
|
|
Orkney
|
291
|
|
Dumfries and Galloway
|
274
|
|
South Ayrshire
|
221
|
|
Moray
|
160
|
|
Fife
|
148
|
|
Scottish Borders
|
106
|
|
East Lothian
|
94
|
|
Angus
|
53
|
|
North Ayrshire
|
34
|
|
Edinburgh City
|
17
|
|
Aberdeen City
|
16
|
|
TOTAL
|
4,860
|
Shellfish fishing has come to dominate all but the major Scottish fishing ports like Lerwick, Peterhead and Fraserburgh. Overall fishing effort has decreased significantly since 2000 due mainly to steadily increasing start-up costs and fisheries management efforts to promote stock recovery.
Marine Scotland, in line with other UK Fisheries Administrations, operates a restrictive licensing policy maintaining a regulatory cap on capacity and fishing effort. To obtain a commercial fishing licence for the first time, an existing entitlement has to be secured from a current licence holder. An entitlement becomes available when a licence is no longer attached to an active fishing vessel or it may be transferred alongside the purchase of a fishing vessel.
Managing Stocks
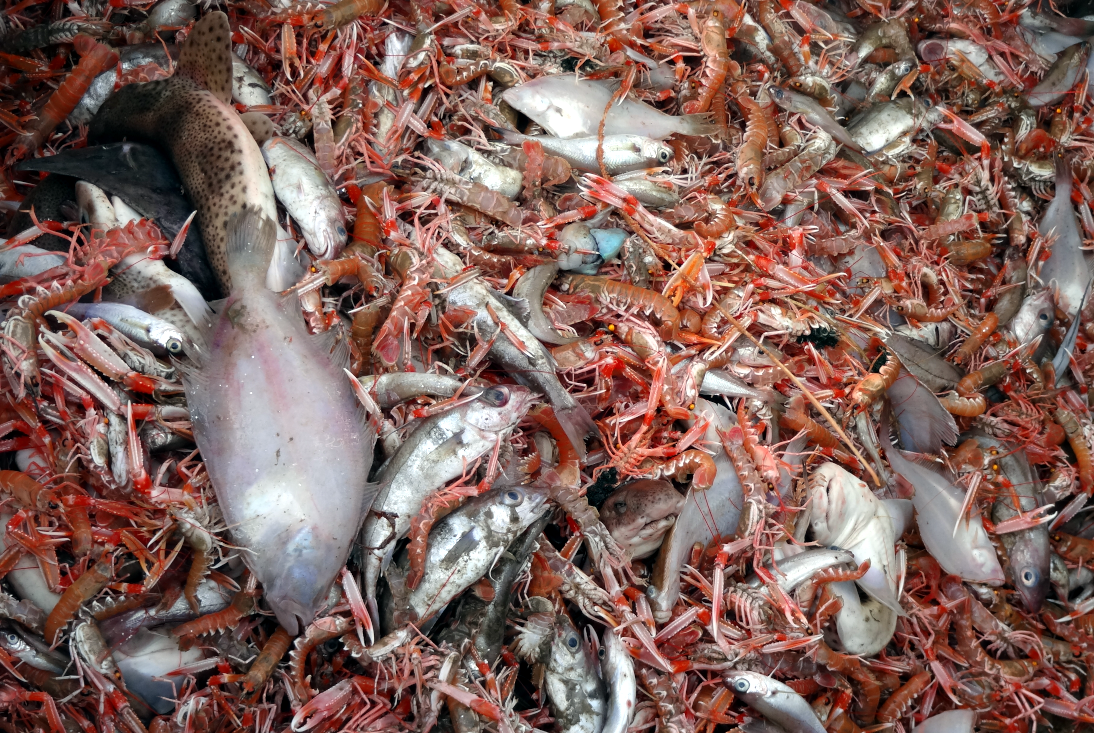
Most fish stocks (see Commercial Fish and Commercial Shellfish assessments) of interest to Scottish fleets span international sea boundaries, and are often caught in mixed fisheries (where a single haul can bring in many different species). This can lead to complicated interactions between the regulations imposed by different nations on different stocks.
For stocks that occur exclusively within the waters of European Union (EU) member states the amount of fish caught is regulated by the EU through the Common Fisheries Policy (CFP).
For stocks that cross international boundaries fishing opportunities are negotiated between the relevant countries. The key third country negotiations for Scotland are bilaterals with Norway (for fisheries in the North Sea) and the Faroe Islands (for quota exchanges and reciprocal access arrangements), as well as multi-party Coastal State negotiations (for pelagic stocks).
In international waters beyond the EEZ, management of stocks is agreed through Regional Fisheries Management Organisations (RFMOs) - international organisations formed by countries with fishing interests in an area. Regarding this assessment, the responsible RFMO is the North East Atlantic Fisheries Commission (NEAFC). NEAFC, recognising the relevant principles laid down by the United Nations Convention on the Law of the Sea (UNCLOS), works to set catch and fishing effort limits, technical measures, and control obligations, for its members.
Scientific advice from the International Council for the Exploration of the Sea (ICES) is used by fisheries managers to guide decisions on catch levels and additional management measures.
There are other important elements to managing the stocks in Scottish waters. The landing obligation, often called the discard ban, introduced from 2015 with full implementation in 2019, requires the landing of all quota managed species.
There are also many Fishing Managed Areas which implement specific restrictions such as: areas where all fishing is prohibited, areas where fishing for certain species is restricted, areas where fishing with static gear is restricted, areas where fishing with mobile gear is restricted and areas where fishing with vessels over a certain length or engine power is restricted. These will often be used to protect sensitive features or ecosystems such as Marine Protected Areas (MPAs) (see Case study: Socio-economic impacts of marine protected areas).
For example, in 2016 specific fisheries measures were put in place on 27 MPAs and a further 39 are currently being developed in partnership with the fishing industry and key stakeholders. While the primary purpose of MPAs is for the conservation of marine features, not stock management, they can nonetheless have the side effect of supporting stock management.
Regional management of inshore fisheries is carried out through a network of Regional Inshore Fishery Groups (RIFGs). These are non-statutory bodies, established in 2016 to replace the six Inshore Fisheries Groups (IFGs) that operated from 2013 to 2016.
Contribution to the economy
Seafood is Scotland’s second largest export, reported through HMRC Regional Trade Statistics and Overseas Trade Statistics as being worth approximately £1 billion in 2017 (Scottish Government, 2018).
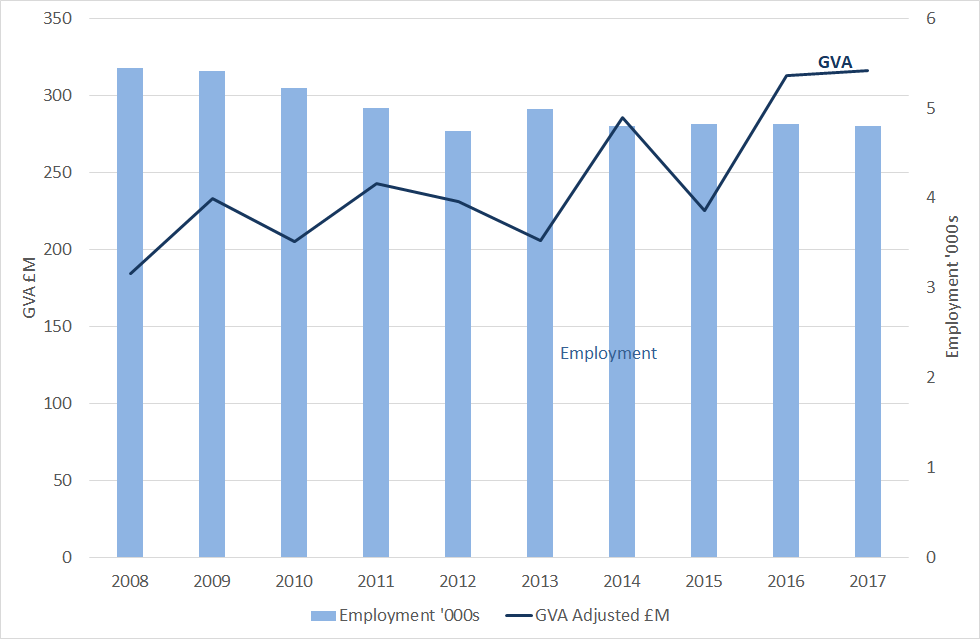
Figures from Scotland’s Marine Economic Statistics (Scottish Government, 2019b) show that in 2017 the fishing sector contributed £316 million Gross Value Added (GVA) (accounting for 0.24% of the overall Scottish economy, and 6 per cent of the marine economy) and provided employment for a headcount of 4,800 people, (0.19% of total Scottish employment, and 6% of the marine economy employment) (Figure 4).
From 2016 to 2017 the GVA from fishing (adjusted to 2017 prices) increased by 1%, while the longer term trend from 2008 to 2017 showed that fishing GVA increased by 72%. Over the same period, employment fell by 12%, though it has been stable in recent years (Figure 4).
To derive the regional trends in sea fishing around Scotland, the value of catches from sea areas around Scotland, including the international waters in the Hatton sea area, was used. The resolution of fish catch reporting, using ICES rectangles, means that the data cannot usually be attributed to Scottish Marine Regions. Data in Table c and Figure h are presented based on the Scottish Seas Areas as used in the 2011 Atlas (Baxter et al., 2011). Figure g shows how the ICES rectangles are assigned to the Scottish Sea Areas.
|
|
Total value 2018
|
Change 2014 to 2018
|
||
|
Scottish Sea Area
|
£m
(2018 prices)
|
£m
|
%
|
Trend
|
|
Bailey
|
1.10
|
-0.19
|
-15%
|
↓
|
|
Clyde
|
11.06
|
-1.07
|
-9%
|
↓
|
|
East Scotland Coast
|
21.38
|
4.92
|
30%
|
↑
|
|
East Shetland
|
88.14
|
10.38
|
13%
|
↑
|
|
Faroe Shetland Channel
|
3.81
|
1.03
|
37%
|
↑
|
|
Fladen
|
86.28
|
24.84
|
40%
|
↑
|
|
Forth
|
10.33
|
0.33
|
3%
|
↔
|
|
Forties
|
5.69
|
-2.35
|
-29%
|
↓
|
|
Hatton
|
1.03
|
0.98
|
2187%
|
↑
|
|
Hebrides
|
25.28
|
-36.93
|
-59%
|
↓
|
|
Minches and Malin Sea
|
61.50
|
0.64
|
1%
|
↔
|
|
Moray Firth
|
15.02
|
1.68
|
13%
|
↑
|
|
North Scotland Coast
|
182.90
|
24.80
|
16%
|
↑
|
|
Rockall
|
8.59
|
-0.03
|
0%
|
↔
|
|
Solway Firth and North Channel
|
5.45
|
1.15
|
27%
|
↑
|
|
West Shetland
|
122.34
|
30.90
|
34%
|
↑
|
|
Total all regions
|
649.89
|
61.09
|
10%
|
↑
|
Note this map uses Scottish Sea Areas rather than Scottish Marine Regions / Offshore Marine Regions. Map can be accessed on Marine Scotland Maps NMPi (search ‘Fishing Statistics’) allowing user to zoom into the detail of the graphs.
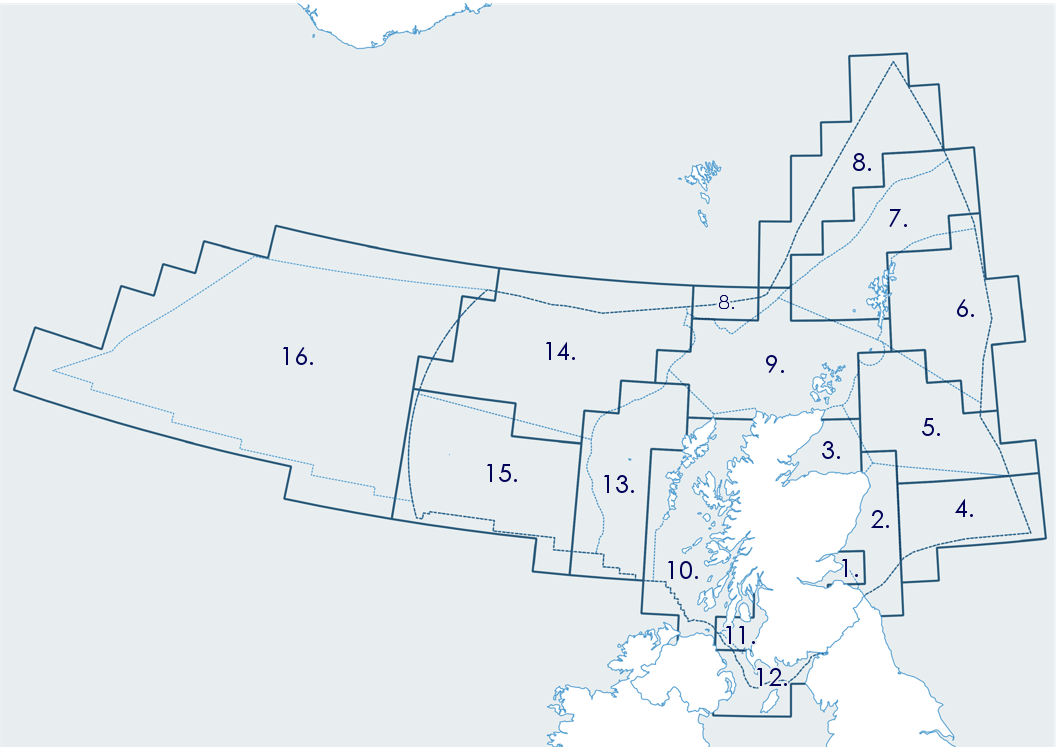
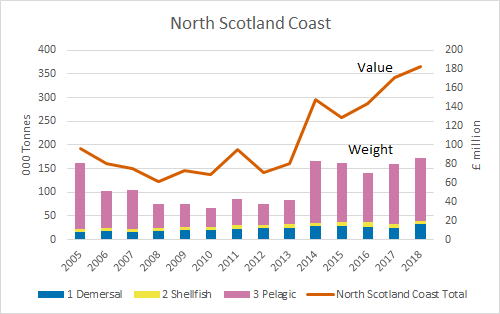
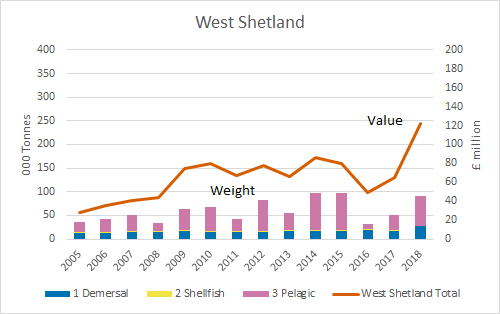
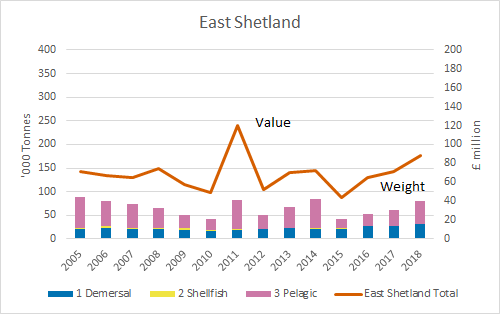
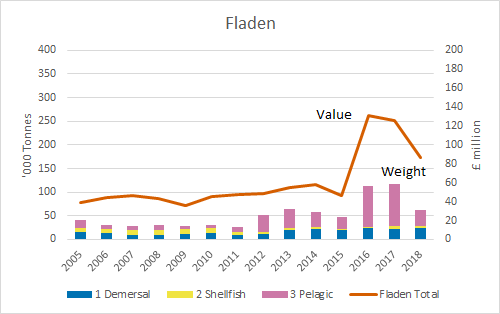
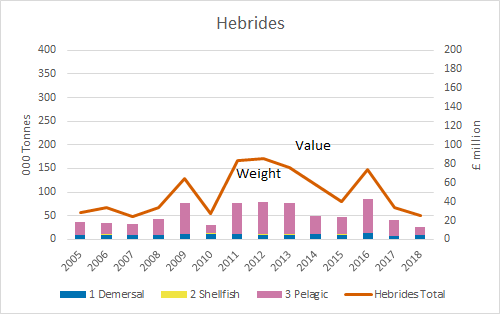
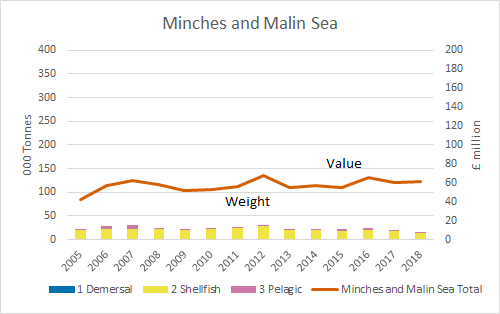
Figure h: Value and tonnages from the six Scottish sea areas with the highest reported catches (2005 - 2018).
Source: Marine Scotland. Graphs for all Scottish Sea Areas, as well as based on the Marine Strategy Framework Directive reporting areas, are available on the Marine Scotland Information web site under ‘Data Sources’ tab on this page.
Examples of socio-economic effects
- Long and significant fishing history.
- Important for remote coastal communities.
- Resource is high quality, nutritious and potentially sustainable source of protein important for food security.
- Component of international trade.
- Fishing increasingly competes for sea space with other marine economic activities.
- Most fish caught is exported while most fish eaten is imported.
- Scotland’s proximity with rich fishing grounds have resulted in a long and significant fishing history of tremendous cultural importance.
- In remote coastal communities catching and processing of fish and shellfish remains a vital source of employment (both full and part-time).
- Fish and shellfish are a high quality, nutritious and potentially sustainable source of protein.
- Our supply of commercially caught fish and shellfish is vital component in achieving food security.
- Whether as a member of the EU or a coastal state, fish and shellfish will remain a significant component of Scotland’s international trade.
- Fishing increasingly competes for sea space with other marine economic activities such as renewable energy, tourism and aquaculture.
- Most fish caught in Scottish waters is exported while most fish eaten within Scotland is imported.
Pressures on the environment
An OSPAR agreed list of marine pressures is used to help assessments of human activities in the marine environment. The marine pressure list has been adapted for use in Scotland via work on the Feature Activity Sensitivity Tool (FeAST). Fishing activities, through 16 FeAST activity types, can be associated with 15 marine pressures – please read the pressure descriptions and benchmarks for further detail.
The list of marine pressures is used to help standardise assessments of activities on the marine environment, and is adapted from an agreed list prepared by OSPAR Intercessional Correspondence Group on Cumulative Effects (ICG-C) (see OSPAR 2014-02 ‘OSPAR Joint Assessment and Monitoring Programme (JAMP) 2014-2021’ Update 2018’ (Table II).
The Feature Activity Sensitivity Tool (FeAST) uses the marine pressure list to allow users to investigate the sensitivity of Scottish marine features. It also associates all pressures that might be exerted by a defined list of activities at a particular benchmark. The extent and impact of each pressure from a given activity will vary according to its intensity or frequency. The extent and impact of the pressure will also vary depending on the sensitivity of the habitat or species on which it is acting. The existence of multiple activities, and potentially multiple pressures, at specific locations will result in a cumulative impact on the environment.
FeAST is a developing tool. A snap shot from 2019 was used for the development of SMA2020. Please consult the FeAST webpage for further information and up to date information.
The list of pressures below associated with this activity is given in alphabetical order. Clicking the pressure will give you more information on the pressure and examples of how it may be associated with the activity.
Forward look
Scotland’s fisheries operate within a strategic international and domestic framework designed to deliver responsible and sustainable fisheries management.
To secure the long term future of the Scottish fisheries sector, marine biodiversity needs to be considered in multiple ways. For example, commercially important fish and shellfish stocks must be harvested within sustainable limits. Also non-target species populations and the wider marine food web must not be adversely affected by fishing activity. Habitats too must be protected to support the lifecycle of all species and help maintain healthy populations. The approach to managing Scotland’s fisheries sustainability will be contained within the Future Fisheries Management Strategy due to be published in 2020.
Management measures, such as a workable catching policy, are required to reduce bycatch and discards, and to ensure stocks remain productive and sustainable. Such measures will be supported by modernised, risk-based monitoring such as Remote Electronic Monitoring.
Scotland is investing in the modernisation of the inshore fishing fleet and will extend appropriate and proportionate remote electronic monitoring technology to the entire commercial fleet. This will begin with the scallop dredge sector in 2020 and extend to encompass all commercial fishing vessels of under 12 metres length. Increasing use of Remote Electronic Monitoring will foster confidence and accountability in commercial fishing.
Economic trend assessment
Trends in value of catch from Scottish Sea Areas, including the international waters in the Hatton sea region. Change from 2014 to 2018 (2018 prices). Includes landings by all UK vessels (of all lengths) and landings by foreign vessels into the UK. Excludes fish caught in Scottish sea areas by non-UK vessels and landed outside the UK.
|
Scottish Sea Area |
Trend |
|
Bailey |
|
|
Clyde |
|
|
East Scotland Coast |
|
|
East Shetland |
|
|
Faroe Shetland Channel |
|
|
Fladen |
|
|
Forth |
|
|
Forties |
|
|
Hatton |
|
|
Hebrides |
|
|
Minches and Malin Sea |
|
|
Moray Firth |
|
|
North Scotland Coast |
|
|
Rockall |
|
|
Solway Firth and North Channel |
|
|
West Shetland |
|
|
National level |
|
This Legend block contains the key for the status and trend assessment, the confidence assessment and the assessment regions (SMRs and OMRs or other regions used). More information on the various regions used in SMA2020 is available on the Assessment processes and methods page.
Status and trend assessment
|
Status assessment
(for Clean and safe, Healthy and biologically diverse assessments)
|
Trend assessment
(for Clean and safe, Healthy and biologically diverse and Productive assessments)
|
||
|---|---|---|---|
 |
Many concerns |
No / little change |
|
 |
Some concerns |
Increasing |
|
 |
Few or no concerns |
Decreasing |
|
 |
Few or no concerns, but some local concerns |
No trend discernible |
|
 |
Few or no concerns, but many local concerns |
All trends | |
 |
Some concerns, but many local concerns |
||
 |
Lack of evidence / robust assessment criteria |
||
| Lack of regional evidence / robust assessment criteria, but no or few concerns for some local areas | |||
 |
Lack of regional evidence / robust assessment criteria, but some concerns for some local areas | ||
| Lack of regional evidence / robust assessment criteria, but many concerns for some local areas | |||
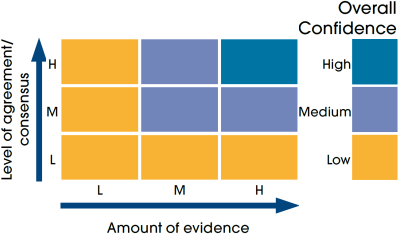
Confidence assessment
|
Symbol |
Confidence rating |
|---|---|
|
Low |
|
|
Medium |
|
|
High |
Assessment regions
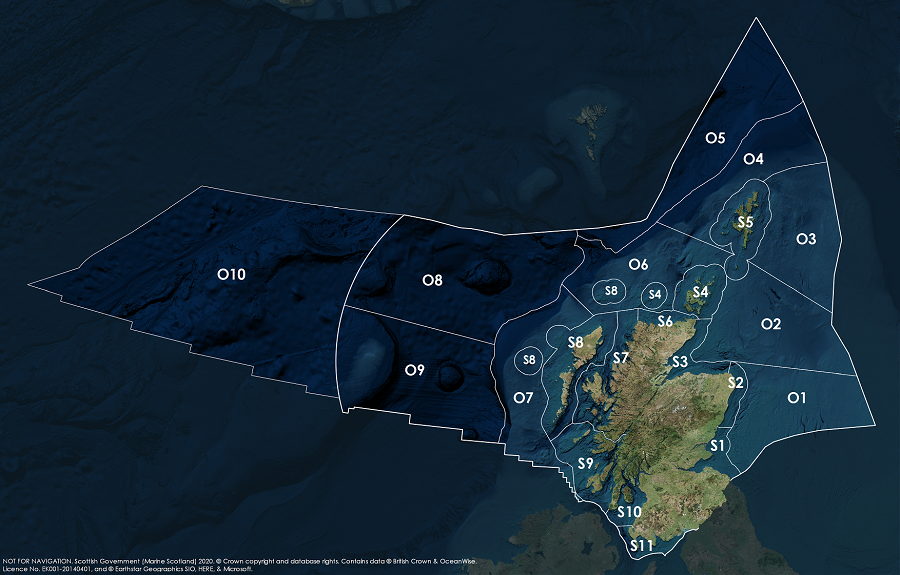
Key: S1, Forth and Tay; S2, North East; S3, Moray Firth; S4 Orkney Islands, S5, Shetland Isles; S6, North Coast; S7, West Highlands; S8, Outer Hebrides; S9, Argyll; S10, Clyde; S11, Solway; O1, Long Forties, O2, Fladen and Moray Firth Offshore; O3, East Shetland Shelf; O4, North and West Shetland Shelf; O5, Faroe-Shetland Channel; O6, North Scotland Shelf; O7, Hebrides Shelf; O8, Bailey; O9, Rockall; O10, Hatton.
